


A New Look at Performance Monitoring for Energy Storage


Performance monitoring for the energy storage industry has traditionally meant a hodge podge of different systems, often based on outdated technologies and interfaces, with limited or no ability to communicate with other systems. This has led to a lack of trust in what, if any, insights are provided.
A new look at performance monitoring in battery-based energy storage systems (BESS) brings a holistic, cloud-based approach that incorporates data from disparate systems and workflows into a single, value-based view. Before we talk about what this looks like and what value it adds, let’s first consider what “performance” really means.

In the context of a battery energy storage system, “performance” is such a multifaceted term that it requires some organizing principle for it to become useful. Different stakeholders approach performance differently, since each has different optimization targets and timescales in which to reach them.
Specifically:
- Operators aim to optimize direct operational metrics, such as state of health and availability.
- Utilities value maintaining grid stability and reliability, via applications for frequency and voltage regulation.
- Owners aim to maximize financial metrics such as ROI, remaining useful life (RUL), and NPV.
- Societies and their representative governments increasingly demand renewable energy, where reducing greenhouse gas emissions is the key success metric.
These success criteria are, for the most part, aligned with one another; but they also build on each other. With modern monitoring tools now able to capture, parameterize, store, and process data at scale in the cloud, a layered approach to generating successively more sophisticated and context-specific performance indicators from a foundation of directly sensed streaming data, in real time, becomes feasible. The approach, in effect, is to build a “value chain'' for data.
The levels of data build upon each other, like links in a chain, to provide increasingly sophisticated insights. The initial, most basic “link” in the data value chain is empirical data, captured in real time by sensors in the cells, strings, and energy blocks, and visualized directly as time series — for attributes such as voltage, current and temperature.
The next link is derived metrics, directly enabled by the raw inputs. Calculating the maxima, minima, and distributions of voltages and temperatures across cells in a string or block provides a quick sense of balances (or imbalances) in the system. Various algorithmic models allow the accurate calculation of state of charge of a string as a live attribute, based on current and voltage.
.jpg)
These outputs, when fed to a condition-action rules engine, can generate many of the alerts that an operator needs to monitor for events such as overheating, voltage imbalances, and downtime.
The following link in the data value chain provides the data required for maintenance planning, where discrete data points for each charge and discharge cycle are calculated by collapsing the millions of live granular points into algorithmically derived metrics that characterize a battery’s state of health. These cyclic attributes include equivalent cycles, a measure of battery use, and indicators of battery health such as energy efficiency across a cycle and maximum capacity at top of charge, both of which degrade with aging.
A number of links, or levels of data insight, exist beyond these initial three. Let’s talk about what those include. Firstly, while the data attributes we’ve already spoken about are sufficient for condition-based maintenance regimes, where individual batteries are replaced when they show sufficient performance degradation, machine-learning algorithms can go one better. By training them on the historical time series and cyclic data of individual serialized batteries, they can provide Remaining Useful Life (RUL) estimates or flag incipient anomalies, enabling predictive maintenance regimes that can dramatically cut downtime and costs.
It’s always good to keep in mind that performance is, above all, a financial metric. Maximizing the ROI of a BESS means using its available cycles smartly. To accomplish this, we can link the existing value chain datasets with time series data sourced externally. For example, weather data subscriptions provide forecasts for temperature, humidity, cloud cover, and wind speed, while market data subscriptions provide day-ahead energy prices. These external data sources can add an additional dimension to your dataset, driving new insights such as determining when to charge or discharge a BESS to maximize revenues for the cycle. A modern energy management system (EMS) can automate these decisions, locking in maximized cost savings.
While optimized charging cycles can have a positive impact, even smarter financial optimization is now possible with a modern performance monitoring solution. Purchasing power agreements, warranty agreements, and leasing arrangements are essentially codified rulesets for BESS operating envelopes, with penalties for transgressions and rewards for beneficial use patterns. A condition-action rules engine can ingest these rulesets as data, with verifiable proof of transgression events and automated score-keeping. It now becomes possible to pursue an operating regime where the occasional out-of-envelope event is justified, if the expected revenue gain outpaces the penalty. Conversely, with all this available data, it becomes possible to accurately model the Net Present Value (NPV) of a BESS when a leasing arrangement ends, or the asset is sold or held as collateral.
Perhaps the most holistic — and freshest — measure of performance is a societal metric: How efficient is a BESS at reducing greenhouse emissions? Every kilowatt-hour of renewable energy provided by a BESS to the grid (because of peak shaving, curtailment avoidance, or price arbitrage) directly impacts the global cumulative carbon footprint. That number, in tons of CO2 equivalent, is calculable once we know how much the BESS is contributing to the energy mix of the local grid.
While a strategy of using a renewable energy BESS to avoid curtailment events at all costs is likely the most impactful in terms of reducing CO2 equivalent, this may not be the strategy that maximizes revenue. But since both strategies can be modeled from the abundance of data in the holistic data value chain, so can the revenue differential, which can form the basis for calculating governmental incentives to do the right thing.
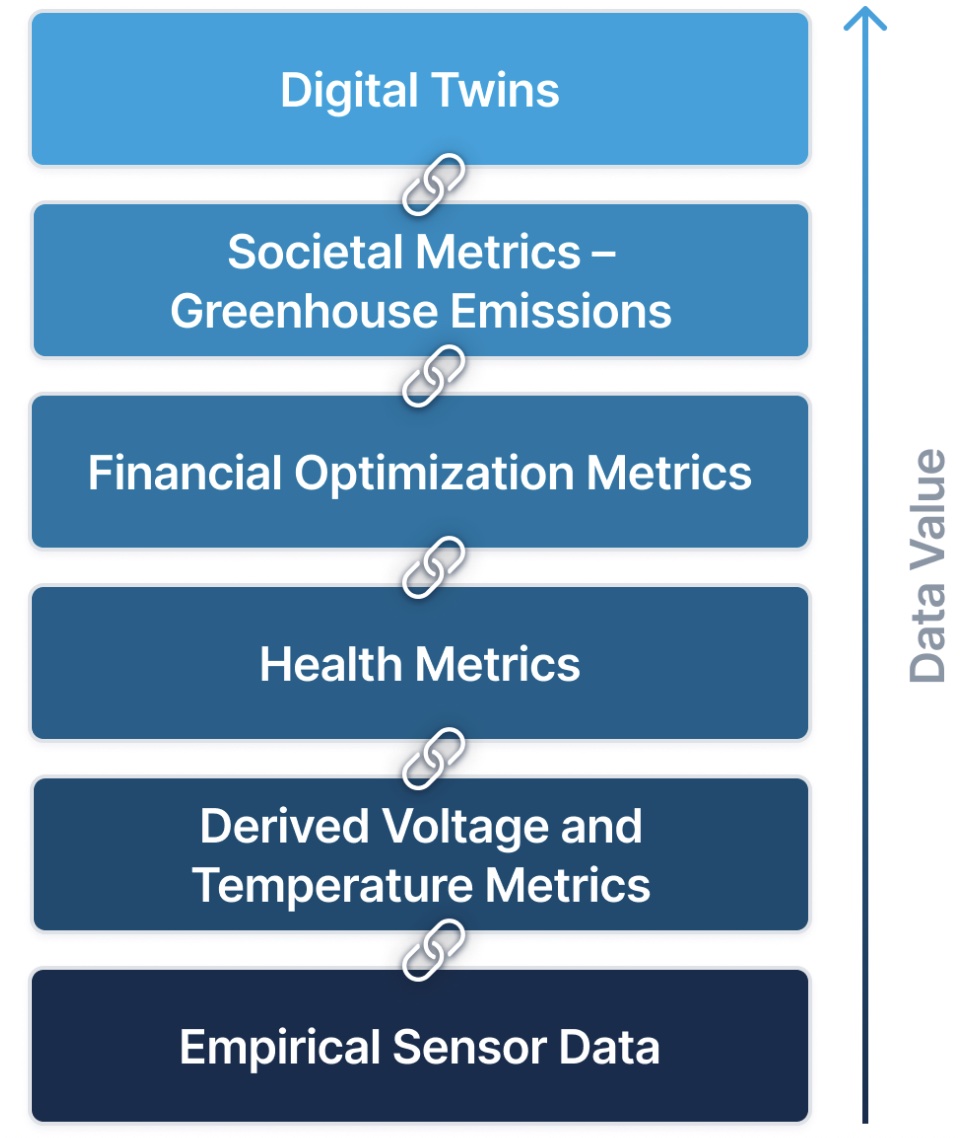 Modeling performance scenarios for a specific BESS based on its unique historical data, and then seeing how well the real-world equivalent matches its “digital twin” (and adjusting the model accordingly), puts us at the apex of the data value chain. A modern performance monitoring solution can derive a unique degradation curve for each and every battery under management – preferably down to the individual serial number – and calculated from the usage patterns and ambient conditions described above.
The battery data value chain is an approach to analyzing battery data down to the individual serial number. Unlike fleet or system-wide metrics, serialized data threading allows for increasingly sophisticated analysis of an individual battery’s health and performance, with each level or “link” building on the one before it.
Not only have the analytical insights grown increasingly more sophisticated as we’ve added link after link, they are, above all, more relevant and able to adapt to the specific optimization criteria of the stakeholder. A modern performance monitoring solution should be flexible enough to accommodate both these varying levels of criteria as well as build a full data value chain based on the data you already have, no matter where it resides.
Stefan Greens is Director of Product Design for Peaxy, Inc. For over two decades, Stefan has focused on user-centric design and communication. He co-founded the Swedish design agency Äventyret, where he helped major institutions develop digital product strategies. Working for the Swedish foreign ministry, Stefan developed and implemented the national digital strategies for public diplomacy in China and the Middle East, and helped design Sweden’s current brand identity. Stefan’s user interface design experience covers data visualization projects, augmented reality, and virtual reality. Stefan holds an MA in International Affairs and Economics from the Johns Hopkins School of Advanced International Studies. View LinkedIn ›
Peaxy | peaxy.net
Author: Stefan Greens
Volume: 2022 July/August