


Mapping a New Atlas for Offshore Wind


A key challenge in the offshore wind industry is the assessment of the resource, essential throughout the different stages of a development project, from screening of areas of interest, to optimization of wind farm layouts to account for spatial heterogeneities and wake losses.
Floating lidars have been established since 2023, with the University of Maine collaborating on the first deployed unit. This enhances the array of solutions available, extending from core expertise in processing raw satellite observations to numerical modeling of the atmosphere, for the benefits to renewable energy stakeholders seeking integrated options.
Regulated by international standards, methods are usually based on a combination of mesoscale modeling on large areas, and offshore short-term observations at a single location. However, an important level of uncertainty about the actual offshore wind resource remains, particularly in coastal areas where the environmental conditions are complex. Offshore blowing winds, gravity waves, etc., induced by orography effects from the coast and thermal impacts in the land-sea atmospheric transition, result in strong air-sea and land-sea interactions. These are known to be challenging conditions to capture (with one or two lidars) and to model, even at high resolution.
Offshore assessment from space
Spaceborne synthetic-aperture radar (SAR) observations can be used to capture complex air-sea and land-sea interactions in off- and near-shore locations.
SAR provides observations of the Earth surface in almost all-weather conditions, night and day, regardless of the cloud cover. Over the ocean, SAR measures the sea surface roughness, i.e., the surface backscattered signal of the centimeter-scale waves related to surface wind stress that react quickly to air-sea interactions. Other phenomena can sign on the backscattered signal at the sea surface: (i) bright targets (e.g. ships or wind turbines), (ii) marine pollution, rain cells that need special filtering as they are not related to wind, and (iii) atmospheric phenomena in altitude (e.g. convective cells, gravity waves, etc.). Wind farm-induced effects on the atmospheric flow such as single or superposed wakes, far wake, or blockage upstream can also have a signature on the backscattered signal. An example of a standard 1-km resolution surface wind field retrieval from a Sentinel-1A SAR image off the East of England is displayed in Figure 1 (left). Thanks to our enhanced processing algorithms, the SAR signal is cleaned from artefacts and results in the 500-m resolution surface wind field in Figure 1 (right). An additional in-house recalibration is performed based on a machine-learning algorithm trained on 22,000 buoys measurements from the National Data Buoy Center. This leads to a reduced surface wind bias from –0.57m/s to 0.01m/s and a reduced standard deviation from –1.25m/s to 0.85m/s all around the world.
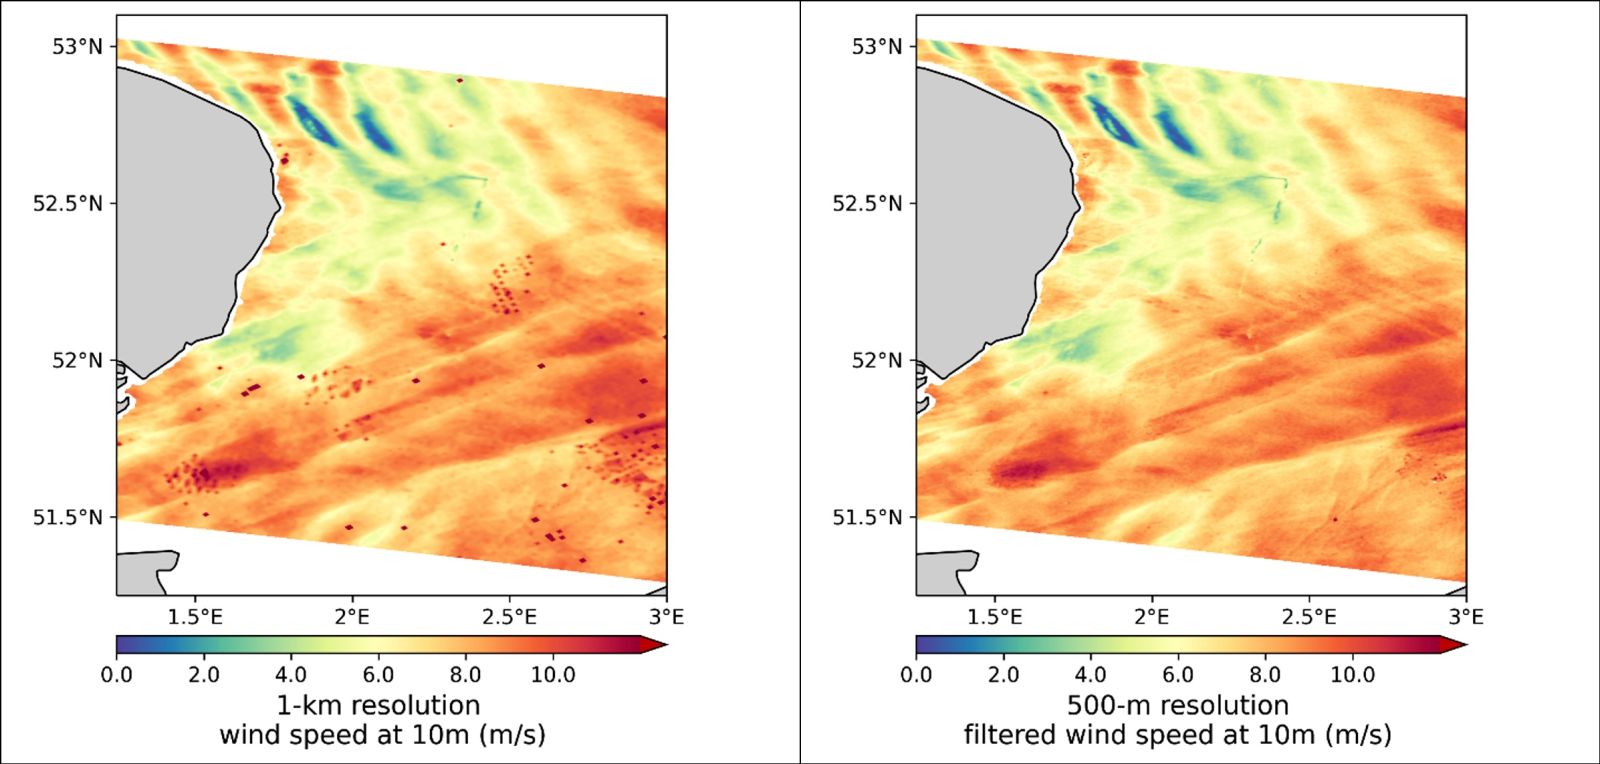
Figure 1. Surface wind speed retrieval from Sentinel-1A SAR observation on 2024-02-04 with standard processing (no bright target filtering, 1-km resolution, left) and enhanced processing (filtering, 500-m resolution).
Satellite and in-situ observations, modeling, and machine learning
To address altitudes relevant to offshore wind projects (40m to 300m), a vertical extrapolation of the SAR surface wind is needed. While current international guidelines recommend the use of power or logarithmic law in absence of measurements in altitude, such empirical formulae need to be calibrated, and are not representative of the complex environmental conditions occurring nearshore. The increasing use of high-resolution mesoscale modeling brings some insight, but still lacks accuracy due to physical parametrization, grid resolution of a few kilometers, and filtering of the numerical schemes.
In order to alleviate the abovementioned drawbacks of standardized methods, especially in coastal areas or in locations with few measurements, a new product is derived and relies on the complementary synergies between high-resolution satellite observations, in-situ data, and mesoscale modeling. A machine-learning algorithm is trained on ten lidars in the North Sea to learn the relationship between SAR surface wind speed and vertical profiles from in-situ measurements and stability-related features from a mesoscale model. The final outputs are enhanced wind atlases at a 500-m resolution, from a 20-year database of satellite observations and the derivation of Weibull parameters.
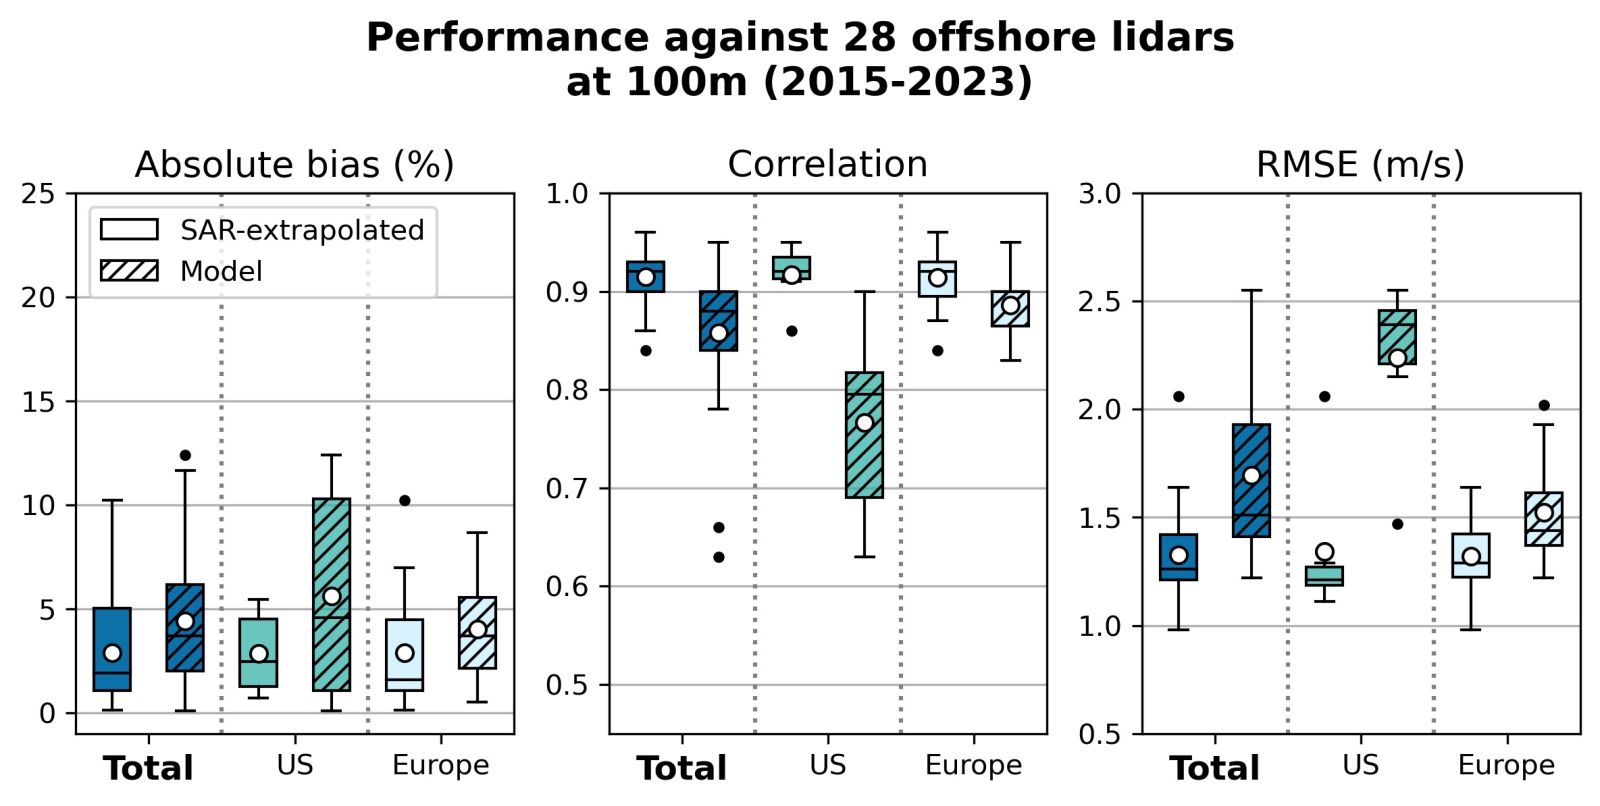
The first stage of the product development focused on Europe, with publications of validation work in peer-reviewed scientific journals and SAR-extrapolated wind speeds provided as data to bidders of two calls for tenders (floating and bottom-fixed) in France. The accuracy is less than 3 percent in terms of wind power density, and less than 4 percent in terms of gross annual energy production. An extensive validation has recently been performed against lidar measurements in the US, China, and other locations in Europe. Figure 2 shows the boxplots of absolute bias relative to the mean in-situ wind speed (left), the correlation (R2, middle) and the root-mean-square error (RMSE, right) of the SAR-extrapolated wind speeds at 100m at six locations in the US, three locations in China, and 19 locations in Europe, from 1km to 102km offshore. For comparison purposes, the performance of opensource high-resolution (2-3km) mesoscale models from research and meteorological centers is displayed (dashed boxplots) alongside the SAR results (plained boxplots). The SAR-derived extrapolation outperforms the mesoscale models in all areas, especially in the US, with median biases less than 2 percent, correlation higher than 0.92 and RMSE less than 1.35m/s. This shows the ability of the SAR-extrapolation algorithm to deal with a broad range of wind regimes in locations different than in the training dataset.
Conclusion
The 20-year database of SAR observations of the surface wind field at a 500-m resolution over >250km areas from three European satellites (ENVISAT and Sentinel-1A and –1B) is an invaluable source of data for offshore site characterization. Offshore wind atlases are derived over Europe, the US, and in Asia-Pacific. They are available before lidar installation or in complement of measurement campaigns. Combined with standardized processes, it allows to significantly reduce the cost of assessment of offshore wind projects. In addition to inflow characterization, SAR observations are also a unique way to observe wind speed deficit by existing wind plants due to blockage or wake effects.
Mauricio Fragoso is Director of Energy at CLS, and Marie Cathelain is a CLS offshore wind expert. With over 30 years in Metocean data and satellite imagery expertise, CLS has been serving the maritime and energy sectors for the development of sustainable solutions.
CLS | groupcls.com
Author: Mauricio Fragoso and Marie Cathelain
Volume: 2024 May/June