


Can Meteorological Models Accurately Characterize Daily Cycles in Wind Generation?


In the United States, the towers of new wind plants often measure greater than 90 meters in height and the rotors themselves can extend another ~60 meters up. The tremendous height of these structures means that wind speeds far above the surface can impact wind generation. The ability to accurately characterize wind speeds at these heights is critical in order to estimate potential wind energy generation, to efficiently integrate wind plants into the electricity grid, to enhance grid reliability and resiliency, and even to design new wind plants themselves.
It is challenging and expensive to measure wind speeds at tower height (~90 meters), and publicly available data, from tall towers or remote sensing, is very limited. Therefore, researchers and practitioners commonly use meteorological models to characterize wind speeds at tower height and above. But, how well do these models work? Can they accurately characterize wind profiles, and what are their limitations?
A new study out of Berkeley Lab and the University of California, San Diego, evaluates three commonly used weather models for their ability to characterize hourly profiles of wind speeds (at tower height) across Texas. The study was published in the journal Wind Energy.
Novel Approach
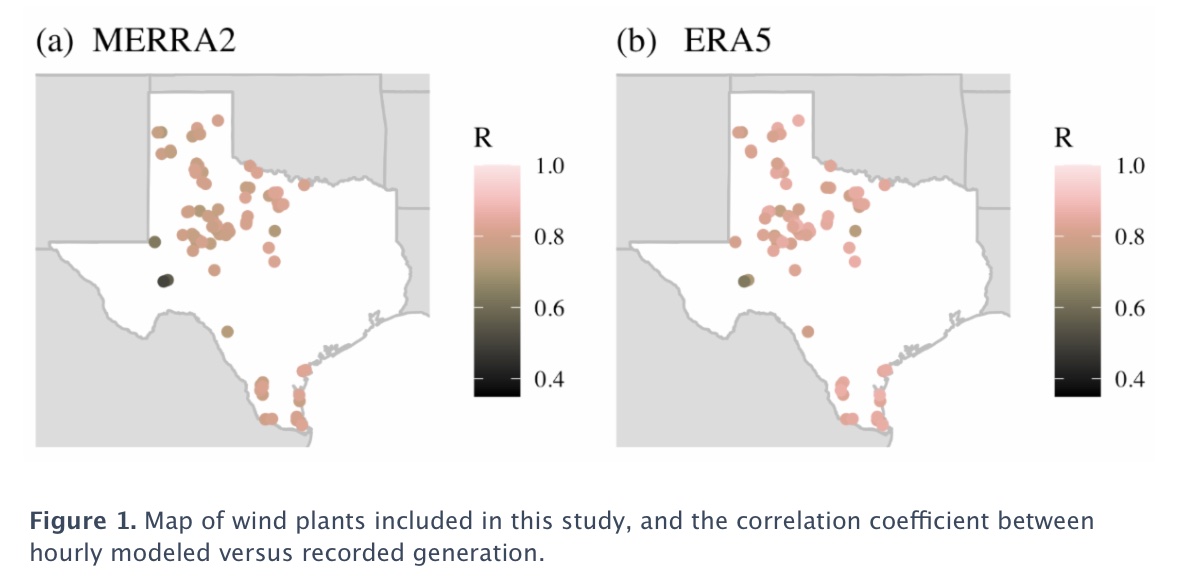
We use a novel approach to evaluate these weather models in order to overcome the lack of wind speed observations at tower heights: We transform modeled wind speeds into wind generation using plant-specific characteristics and then evaluate the modeled wind generation versus a unique dataset of 7 years of hourly generation records from over 100 wind plants in Texas (Figure 1 shows a map of all the plants used in this study). This comparison allows us to evaluate the weather models' ability to represent wind generation resources.
Key Findings
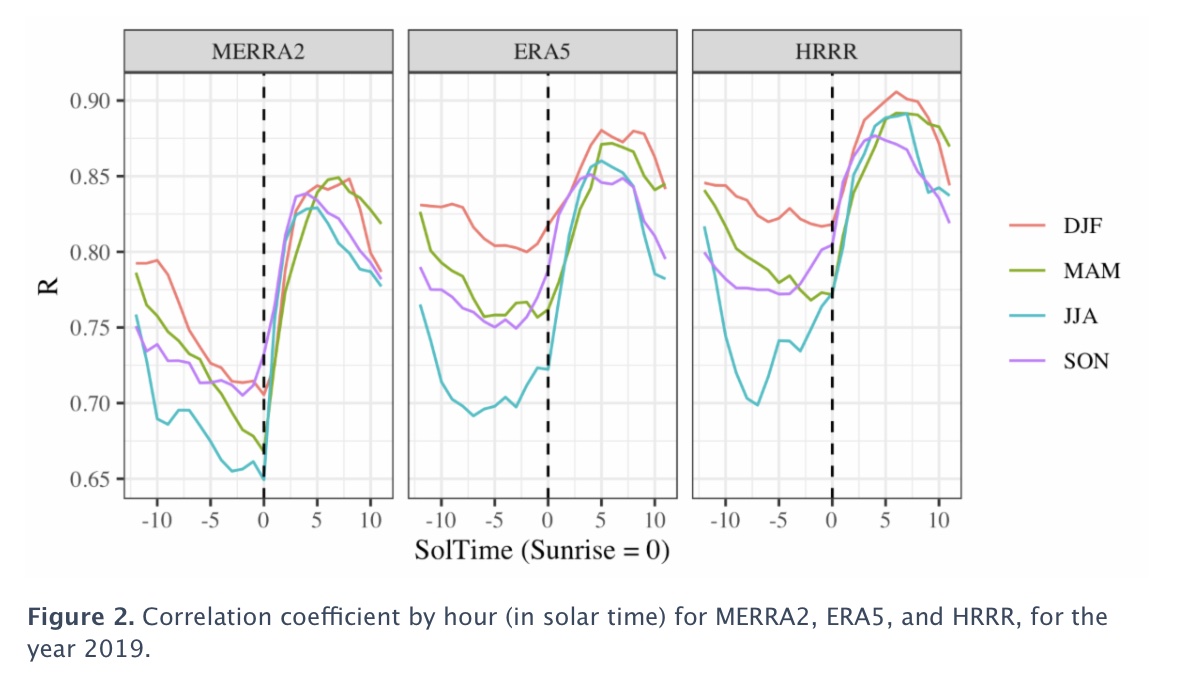
The analysis found that, by some metrics, these weather models performed well, and accurately represented hourly profiles of wind generation resources across Texas. However, the paper also identifies key areas in which the accuracy of these models is limited. Note, our results mostly focus on two of the three models we evaluated (ERA5 and MERRA2), as we evaluated the model HRRR over only a subset of the study period.
- The models represent wind generation with relatively small bias and decent hourly correlation. Specifically, the average error across all hours and plants, in capacity factor terms, was 1.1% for ERA5 and 6.4% for MERRA2 (implying, for example, that a plant with a recorded capacity factor of 40% would be modeled with a 46.4% capacity factor using MERRA2). Average hourly correlation coefficients range from 0.7 to 0.9, depending on the model and hour of the day (see Figure 2).
- Errors were larger on an hourly basis than a daily basis. For example, the probability that modeled capacity factor from the ERA5 model was within ±20% of recorded capacity factor was 78% on an hourly basis, but 99% on a daily basis. Again, this is in capacity factor terms, so, for example, if recorded capacity factor for a day was 80%, there was a 99% probability that the ERA5 model capacity factor was between 60% to 100% for that day and plant. MERRA2 followed a similar pattern, but with slightly lower accuracy in both daily and hourly timeframes.
- Improved geographic model resolution reduced errors and improved correlation. ERA5 (horizontal resolution ~30 km) performed better than MERRA2 (horizontal resolution ~50 km), and HRRR (horizontal resolution 3 km) had the best performance metrics. Though resolution is dramatically different between the models, other methodological differences within the models likely also contributed to performance differences.
- Correlation between modeled and recorded generation declined during nighttime hours, especially during summertime.
Key Implications
The models were very good at representing daily wind generation. Put simply, the models were almost always able to successfully differentiate between high wind generation days and low wind generation days (by the metric of predicting capacity factors within ±20% of the recorded capacity factor). For individual hours, the models were often able to successfully differentiate between high and low wind resource hours, but missed capacity factor by >20% roughly 20% to 30% of the time.
We hypothesize the decline in correlation between modeled and recorded generation during nighttime was due to misrepresentation of the atmospheric boundary layer within these models. At night, the boundary layer often shrinks to heights that would impact wind turbines. Additionally, the ability of models to represent certain meteorological phenomena during the nighttime, such as low level jets, may further degrade model observation agreement. Further research is need to confirm these hypothesis.
Increasing model resolution improves correlation metrics overall, but does not solve the issue of depressed correlation during nighttime.
Practitioners using these weather models to represent wind generation profiles should be aware of their limitations. Further analysis would be beneficial to determine how well these models represent wind profiles in other regions.
Finally, we note that this analysis is not of weather forecasts, but simply of meteorological models of real-time weather conditions. We expect error metrics to decline in quality with forecasts. Further research focused on forecasts is needed to determine their ability to represent hourly generation.
Key Limitations
This approach is predicated on the assumption that there is much more uncertainty in the modeled wind speeds themselves than the conversion between wind speeds and output power. Our conversion of wind speed to generation was relatively simple and, while it did include the use of a plant-specific power curves, it did not account for plant controls, local variation in wind speed, wake losses, and other types of losses. If wake losses were less consistent during nighttime than other periods, it is possible this contributed to the diurnal patterns we observed. That said, wake losses are typically a small portion of annual generation (0 to 10%) and so it is unlikely they caused the type of model performance changes observed. Additionally, our approach cannot account for losses related to plant maintenance, or operational shutdowns due to weather (such as winter icing). However, the error patterns observed are not suggestive of these operational issues playing a major role. We note that had losses been included in the modeled generation, the models would have likely had small negative biases rather than small positive biases.
Another key limitation is that this evaluation applies to Texas region, but is not necessarily applicable to other regions, especially to regions with complex and/or mountainous terrain.
Lawrence Berkeley National Laboratory | emp.lbl.gov