


Annual DOE Report Shows Technology Advancement and Value of Wind Energy


The U.S. Department of Energy (DOE) has released its annual "Land-Based Wind Market Report: 2022 Edition." The release provides an updated overview of data and trends in land-based wind energy in the U.S., in the form of a report, a briefing slide deck, a data file, and a series of interactive data visualizations.
Despite ongoing supply chain challenges, wind energy in 2021 continued to see strong growth, technology improvements, and low prices in the U.S. Key highlights include:
.jpg) Wind comprises a growing share of electricity supply: U.S. wind power capacity grew at a strong pace in 2021, with the 13.4 GW of new additions representing a $20 billion investment and 32% of all newly added U.S. generation capacity. Wind energy output rose to account for more than 9% of the entire nation's electricity supply. At least 247 GW of wind are seeking transmission interconnection; 77 GW of this capacity are offshore wind and 19 GW are hybrid plants that pair wind with storage or solar PV.
Wind comprises a growing share of electricity supply: U.S. wind power capacity grew at a strong pace in 2021, with the 13.4 GW of new additions representing a $20 billion investment and 32% of all newly added U.S. generation capacity. Wind energy output rose to account for more than 9% of the entire nation's electricity supply. At least 247 GW of wind are seeking transmission interconnection; 77 GW of this capacity are offshore wind and 19 GW are hybrid plants that pair wind with storage or solar PV.
Wind project performance has increased over the decades: The average capacity factor among recently built projects was nearly 40%, considerably higher than projects built earlier. The highest capacity factors are seen in the interior 'wind belt' of the country.
Turbines continue to get larger: Improved plant performance has been driven by larger turbines mounted on taller towers and featuring longer blades. In 2011, no turbines employed blades that were 115 meters in diameter or larger, but in 2021, 89% of newly installed turbines featured such rotors. Proposed projects indicate that total turbine height will continue to rise.
.jpg) Low wind turbine pricing has pushed down installed project costs over the last decade: Wind turbine prices averaged $800–$950/kW in 2021, a 5% to 10% increase from the year prior but substantially lower than in 2010. The average installed cost of wind projects in 2021 was $1,500/kW, down more than 40% since the peak in 2010, though relatively stable in recent years. The lowest costs were found in Texas and the (non-ISO) West.
Low wind turbine pricing has pushed down installed project costs over the last decade: Wind turbine prices averaged $800–$950/kW in 2021, a 5% to 10% increase from the year prior but substantially lower than in 2010. The average installed cost of wind projects in 2021 was $1,500/kW, down more than 40% since the peak in 2010, though relatively stable in recent years. The lowest costs were found in Texas and the (non-ISO) West.
.jpg) Wind energy prices are on the rise, but generally remain low, around $20/MWh in the interior of the country with higher prices in the West and East. After topping out above $75/MWh for power purchase agreements (PPAs) executed in 2009, the national average price of wind PPAs has dropped—though supply-chain pressures have resulted in increased prices in recent years. In the interior 'wind belt' of the country, recent pricing is around $20/MWh. In the West and East, prices tend to average above $30/MWh. These prices, which are possible in part due to federal tax support, fall below the projected future fuel costs of gas-fired generation.
Wind energy prices are on the rise, but generally remain low, around $20/MWh in the interior of the country with higher prices in the West and East. After topping out above $75/MWh for power purchase agreements (PPAs) executed in 2009, the national average price of wind PPAs has dropped—though supply-chain pressures have resulted in increased prices in recent years. In the interior 'wind belt' of the country, recent pricing is around $20/MWh. In the West and East, prices tend to average above $30/MWh. These prices, which are possible in part due to federal tax support, fall below the projected future fuel costs of gas-fired generation.
Wind PPA prices are often attractive compared to wind's grid-system market value: The value of wind in wholesale power markets is affected by the location of wind plants, their hourly output profiles, and how those characteristics correlate with real-time electricity prices and capacity markets. The market value of wind increased in 2021, averaging $16/MWh in MISO, $19/MWh in SPP, $23/MWh in NYISO, $31/MWh in ERCOT, $33/MWh in PJM, $44/MWh in ISO-NE, and $48/MWh in CAISO.
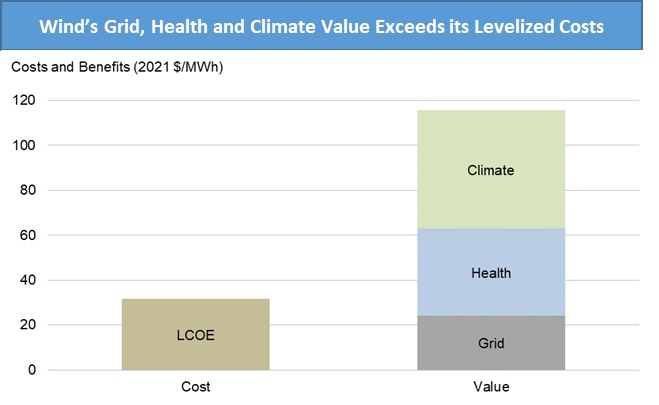 The average levelized cost of wind energy was $32/MWh for plants built in 2021: Levelized costs, which exclude the impacts of federal tax incentives, vary across time and geography. The national average stood at $32/MWh in 2021—down substantially historically, though relatively stable in recent years. Levelized costs were lowest in ERCOT, SPP, and the (non-ISO) West.
The health and climate benefits of wind in 2021 were larger than its grid-system value, and the combination of all three far exceeds the current levelized cost of wind: Wind generation reduces power-sector emissions of carbon dioxide, nitrogen oxides, and sulfur dioxide. These reductions, in turn, provide public health and climate benefits that vary regionally, but together are economically valued at an average of over $90/MWh-wind for plants built in 2021.
LBL | windreport.lbl.gov


.jpg?r=8065)