

Bigger in Texas: Storm Uri highlights importance of Time Series data in solar project design


Two years ago, Storm Uri unleashed a deep freeze over Texas, causing widespread power outages that affected more than 4.5 million people. The drastic changes in temperature during the storm not only reduced natural gas production and froze wind turbines across the State, but also had widespread impacts on solar plants.
When the grid network collapsed during the storm, many PV plants were unable to restore power after shutting down, because the total Open Circuit Voltage (VOC) was higher than their inverters’ DC start-up voltage range – leading toperformance issues and impacting PV power components.
In retrospect, Storm Uri provides an important lesson in solar project design: Having access to solar Time Series data, and using the information gathered from that data during the design stage of a solar project, informs and significantly strengthens a solar project’s resilience to extreme weather events, alongside drastic changes in temperature.
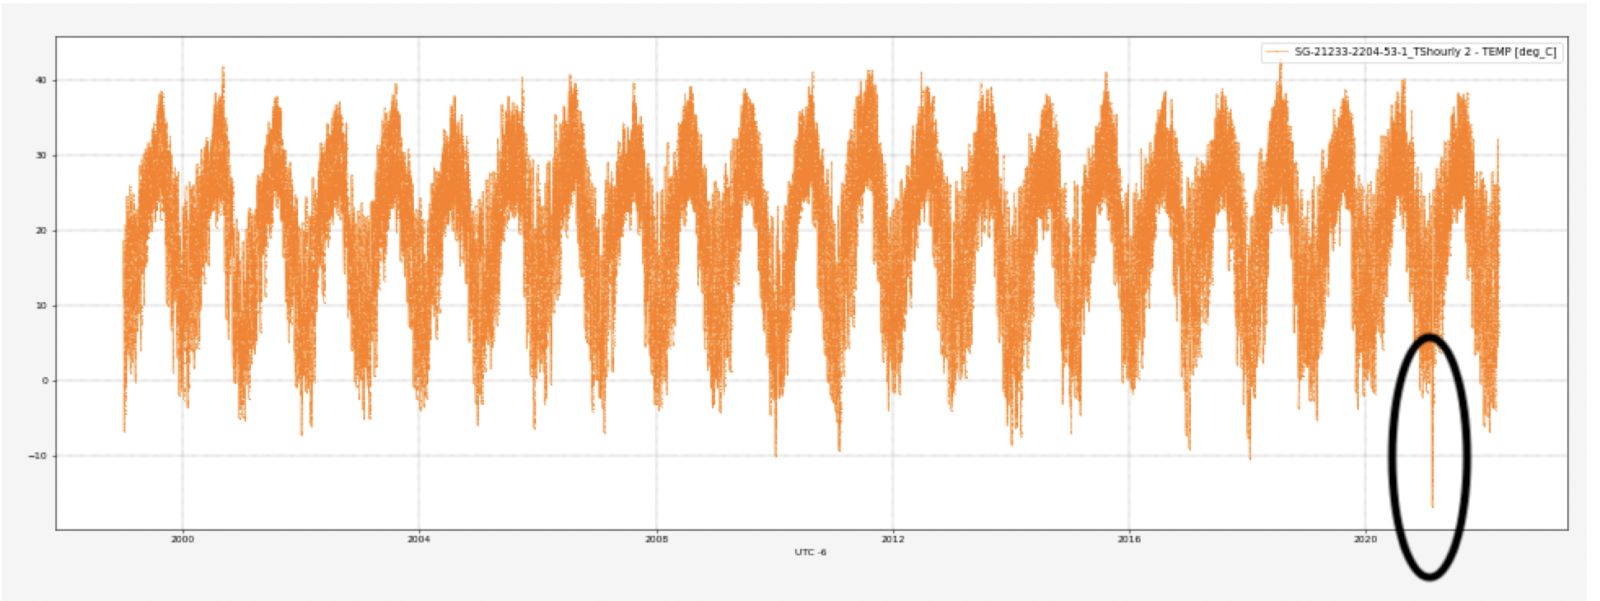
Figure 1: Ambient Temperature (temp) from the year 1999 to 2021
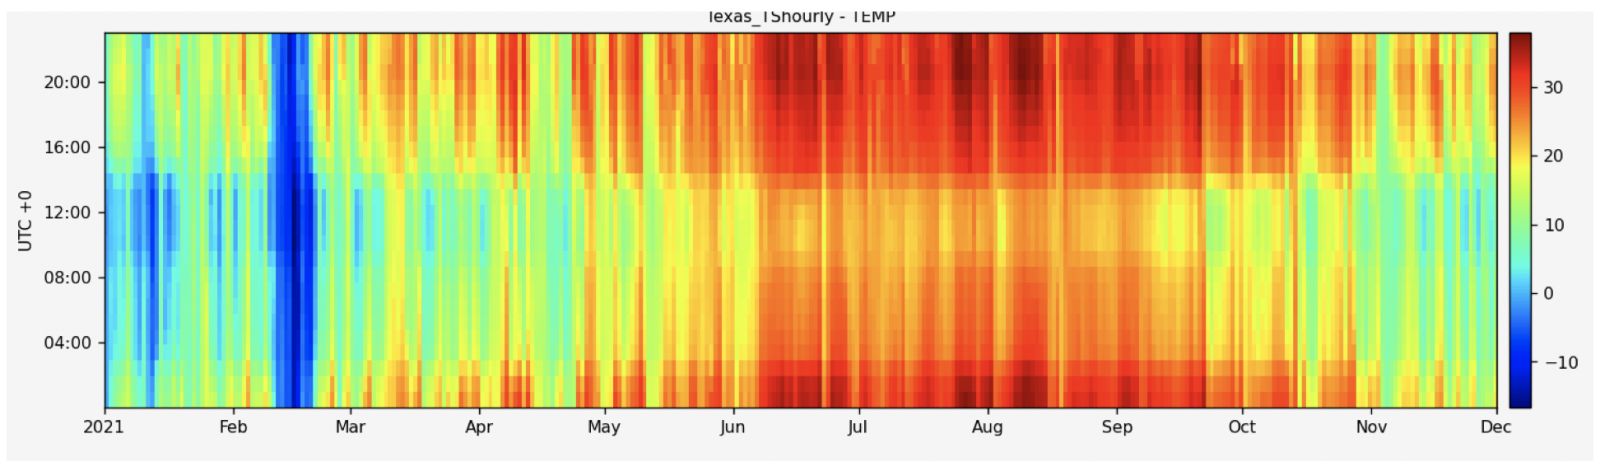
Figure 2: Ambient Temperature Heatmap for 2021
Temperatures were recorded dropping significantly below long-term averages and historical data during Storm Uri, as seen in Figures 1 and 2.
Time Series data vs. TMY datasets
Inverter experts have highlighted the importance of considering extreme weather conditions when designing PV configurations, to ensure system reliability and prevent downtime.
They emphasize that extreme weather events (such as snow, freezing rain, and low temperatures) can cause moisture in the air, which can result in inverters turning off, and over-voltage issues due to lower impedance in cables and electrical wiring.
Solar cells, meanwhile, are temperature-sensitive, and can easily be affected by extreme weather conditions. However, extreme temperatures are usually not considered during the design phase of a solar project. The industry continues to rely on Typical Meteorological Year (TMY) datasets for the design of a project – causing blind spots in design strength, and potentially resulting in greater financial losses, as was seen in the aftermath of Storm Uri.
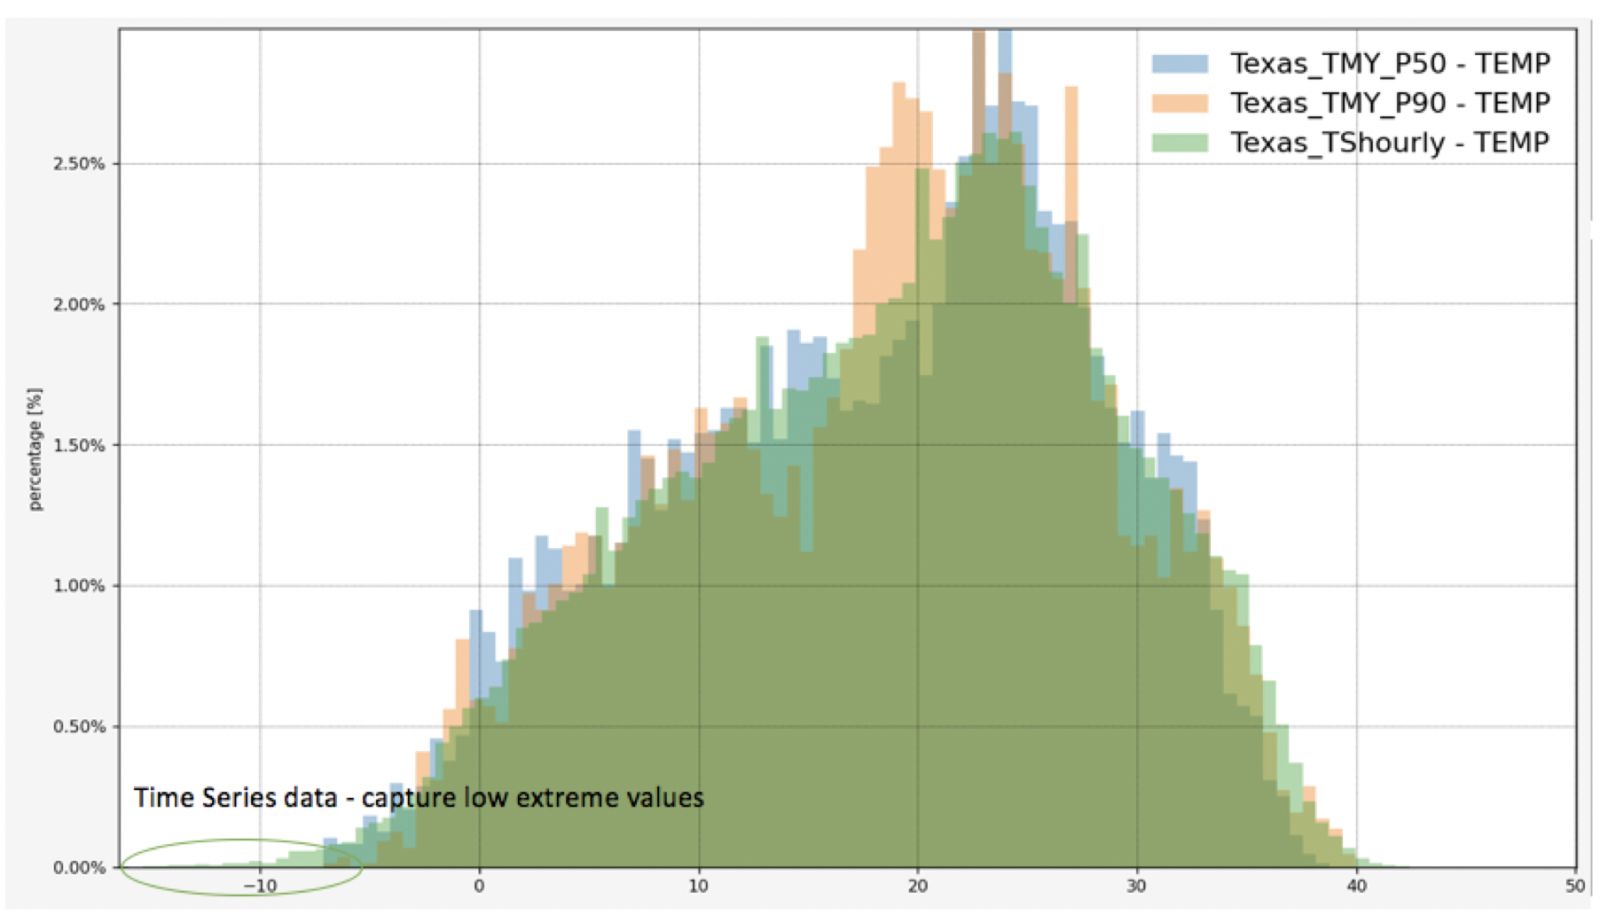
Figure 3: Temperature Histogram: TMY P50 (orange), TMY P90 (blue), Time-Series (green); a histogram of the actual historical data (from 1999 to 2023) and the TMY files are shown
Figure 3 highlights the importance of utilizing accurate data, and not over relying on TMY scenarios in the design and planning of solar power projects. The stark contrast between the temperature values in these datasets – at the time of Storm Uri – can be seen by looking at the negative part of the graph.
The percentage of these negative values is close to zero, illustrating the magnitude of variation that can occur during extreme weather conditions, such as snowstorms. Figure 3 clearly depicts that only the Time Series data accurately captured the extremely low-temperature events (indicated within the circled values), while the TMY datasets could not account for such events, as they represent only typical probabilistic scenarios.
The varying shades of each color in figure 3, which correspond to each dataset, highlight the accumulation of data points – with lighter shades indicating a lower density of data. Once again, this emphasizes the rarity of such low-temperature values that can only be observed through time series files.
The importance of Times Series data in project design
The findings from figure 3 demonstrate the importance of utilizing accurate multi-year Time Series data for a more comprehensive understanding of the potential impacts of extreme weather events on solar power systems.
To strengthen a solar project’s design against such events, it is crucial to study and use accurate data to make informed decisions, particularly throughout the early design phase of solar power projects. Doing so helps determine the number of modules to connect in series and parallel to each inverter, and ensure that projects are built to withstand extreme weather conditions.
Accurate historical temperature and irradiation values are also crucial for analyzing trends, predicting scenarios, and making informed decisions during the design process. Utilizing probabilistic scenarios, analyzing the long-term average, maximum and minimum values of temperature, and irradiance data unlocks better-informed decisions, which helpss to ensure that a solar project is built to withstand extreme weather and temperature conditions.
Giridaran Srinivasan is CEO, Americas, and Celik is Technical Support Expert at Solargis, which has developed and operated platforms enabling fast access to historical, recent, and forecast data for almost any location on the Earth.
Solargis | solargis.com
Author: Giridaran Srinivasan and Zeynep Celik
Volume: 2023 May/June