

Proving Performance: Analyzing populations of I-V curves


Data is vital to understanding the health of any PV installation. Capturing I-V curves during the commissioning or O&M of a large-scale PV plant can result in a significant amount of data. This article details ways of analyzing this data and effectively verifying operation and performance.
I-V curves are plots of current (I) versus voltage (V), and are the most effective way to test the health of a PV string. I-V curves measured during commissioning demonstrate functionality and performance prior to sign-off by the owner, as well as establish a baseline for tracking the health of the arrays during the life of the system. During O&M, they provide a way to monitor on-going performance, troubleshoot problems, and substantiate warranty claims. While open-circuit voltage and clamp-meter measurements are commonly employed during PV measurements, they only provide a limited view. A typical I-V curve contains 100 points or more, whereas Voc and Isc (or Imp) are just two points on the curve; the shape of the curve between these two points can highlight a variety of problems, including bad bypass diodes, cracked cells, shading, high resistance connections, and cell degradation.
.jpg)
Figure 1 Typical I-V curve
During commissioning, I-V curves are typically captured for every string within a combiner box. Outliers are identified and fixed, and then the next combiner box is measured, until all strings in the system have been measured. During O&M, a particular string may be measured repeatedly over the course of years. Accumulating this information can highlight cell degradation, and potentially be used for a warranty claim if the degradation is greater than expected. I-V curve tracing is also used to evaluate PV modules or strings that show up with problems in infrared imaging.
It is convenient to break up the measuring and analysis of large PV plants into smaller blocks. For example, a block might be the 250 strings associated with a single 3MW inverter. Testing this block will result in 250 I-V data sets. Datasets from one or more blocks can be imported into a data analysis tool (supplied by the curve tracer manufacturer). The data analysis tool provides a variety of views of the data. For example, it can plot the I-V curves for the family of strings in each combiner box, as shown in Figure 2.
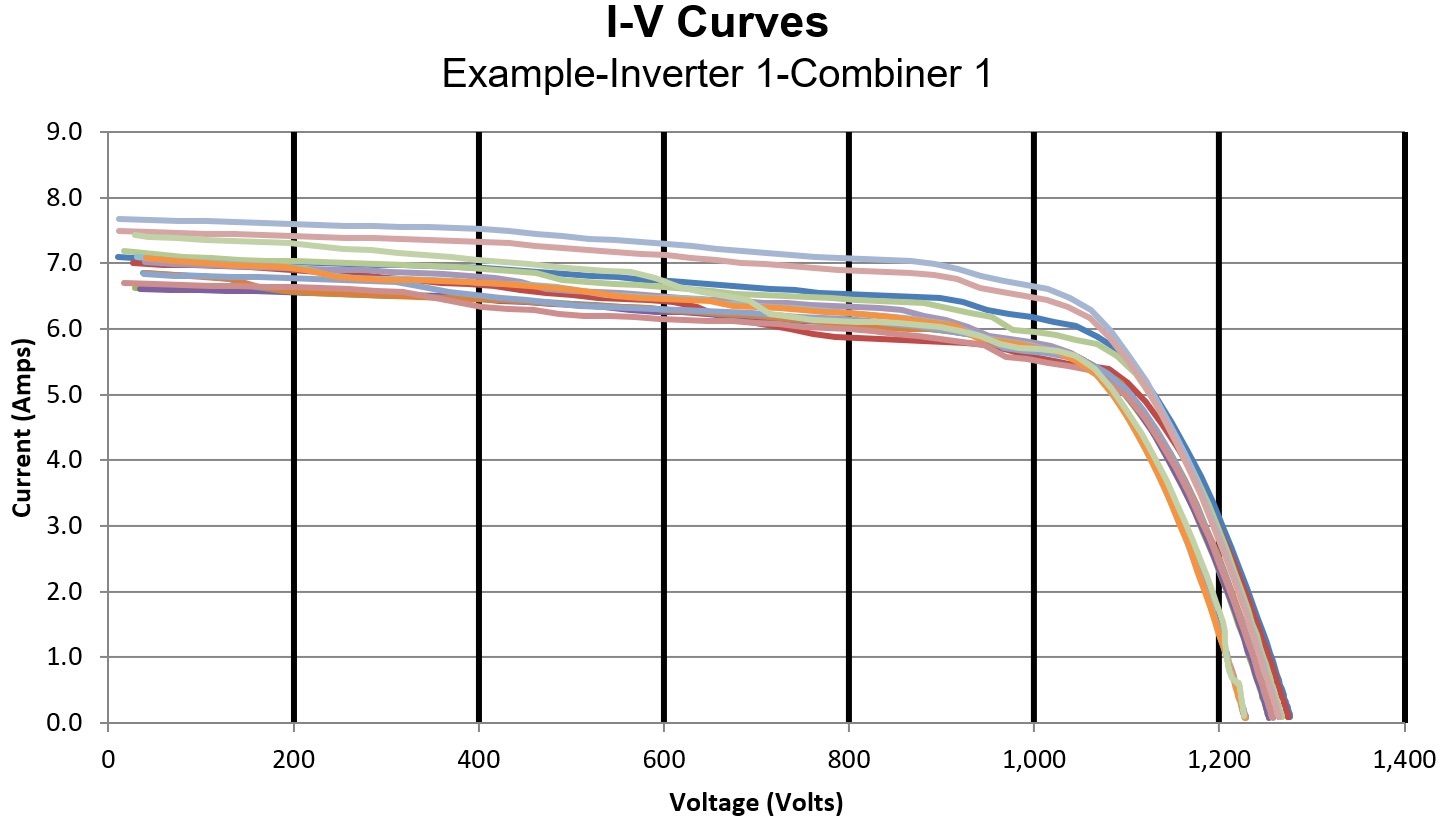
Figure 2-- Population of string I-V curves
I-V curves scale vertically with irradiance or uniform module soiling; they scale horizontally with temperature. This is normal behavior for a healthy string, but variations in irradiance, temperature, and soiling across a population of strings can make is harder to detect anomalies in string performance. However, by normalizing the I-V curves we can remove these effects from the data, highlighting outliers and certain classes of problems, as shown in Figure 3. Here, the curves have been normalized to an arbitrary Isc of 10A and module Voc of 45V. This pins the Isc and Voc points of each curve together. Notice how the shapes of some curves stand out - If you were investigating a low performing combiner box, these stand outs would be the first to look at.
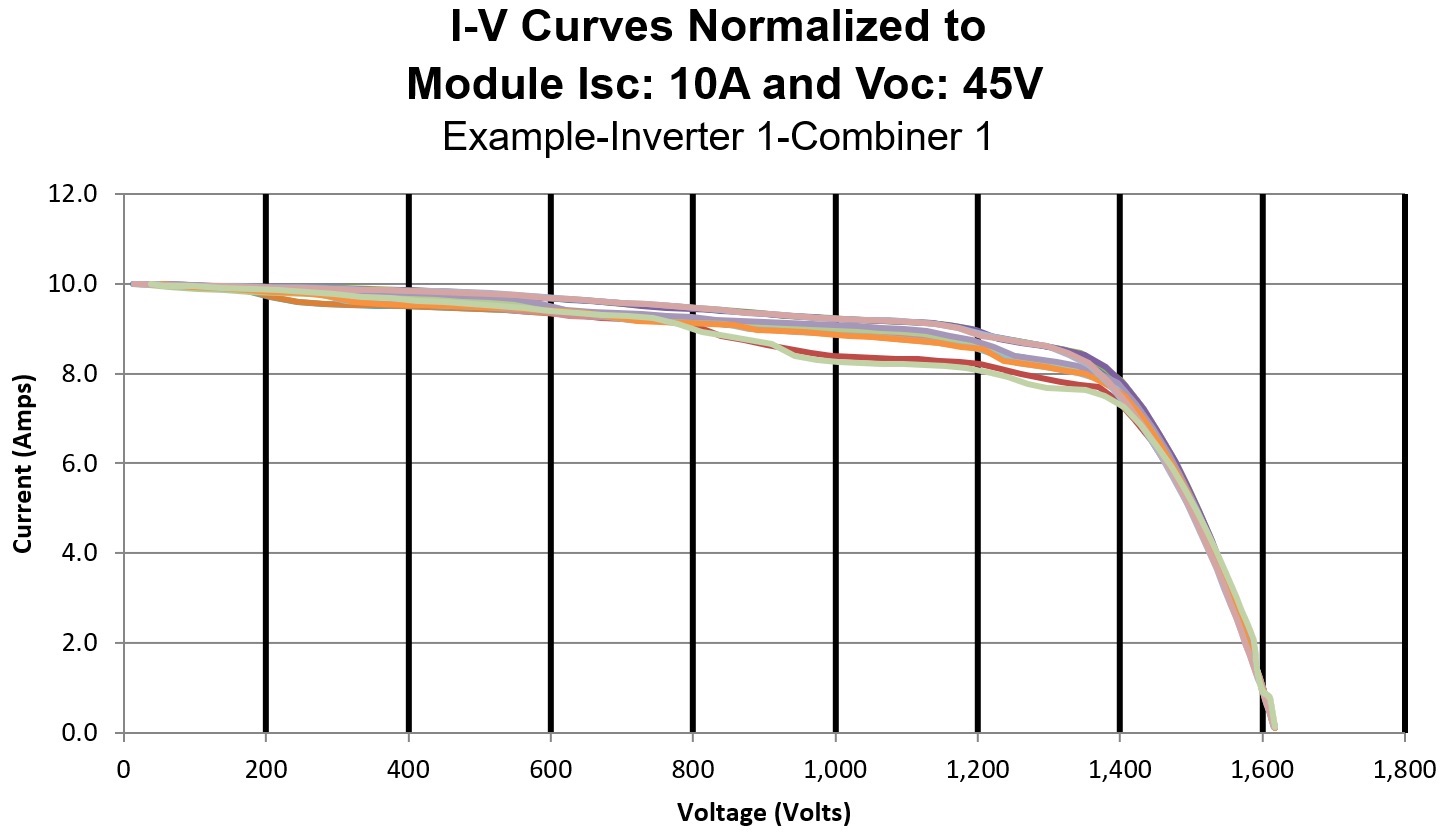
Figure 3-- The same curves normalized to the same Isc and Voc
The I-V curves can alternatively be translated to the Standard Test Conditions (STC) of 1000W/m2 and 25oC. This facilitates comparing the I-V curves to the data sheet for the modules, particularly the Isc and Voc. For instance, you can easily see if a string has uniform soiling or has degraded by comparing the STC-translated Isc to the module data sheet Isc. Or you can see if there is a missing module or shorted bypass diodes in the string by looking at the STC-translated Voc. The normalized plot won't show these particular conditions. Normalization and translation functions are complimentary, and highlight different classes of problems.
Another way to view the data is in histogram form. Figure 4 shows the Performance Factor for a population of I-V curves. Performance Factor (PF) is calculated automatically by the curve tracer software; it's the measured maximum power divided by the expected maximum power, expressed as a percent. A PF value of 100 percent means the string is performing as expected. The measured maximum power is extracted from the measured I-V curve by fitting a polynomial to the power vs. current curve, where each power value is the product of current and voltage from a point in the I-V curve. The expected maximum power comes from a predictive model that takes into account the module specs, irradiance, temperature, time/date, latitude/longitude, and the sun's angle-of-incidence on the plane-of-array. PF is the most important single parameter associated with a string because it expresses the power production capability of the string better than other parameters. The example data in Figure 4 shows that the majority of strings have PF close to 100 percent. But you can see some outliers down near 80 percent: these are the strings to investigate first for problems.
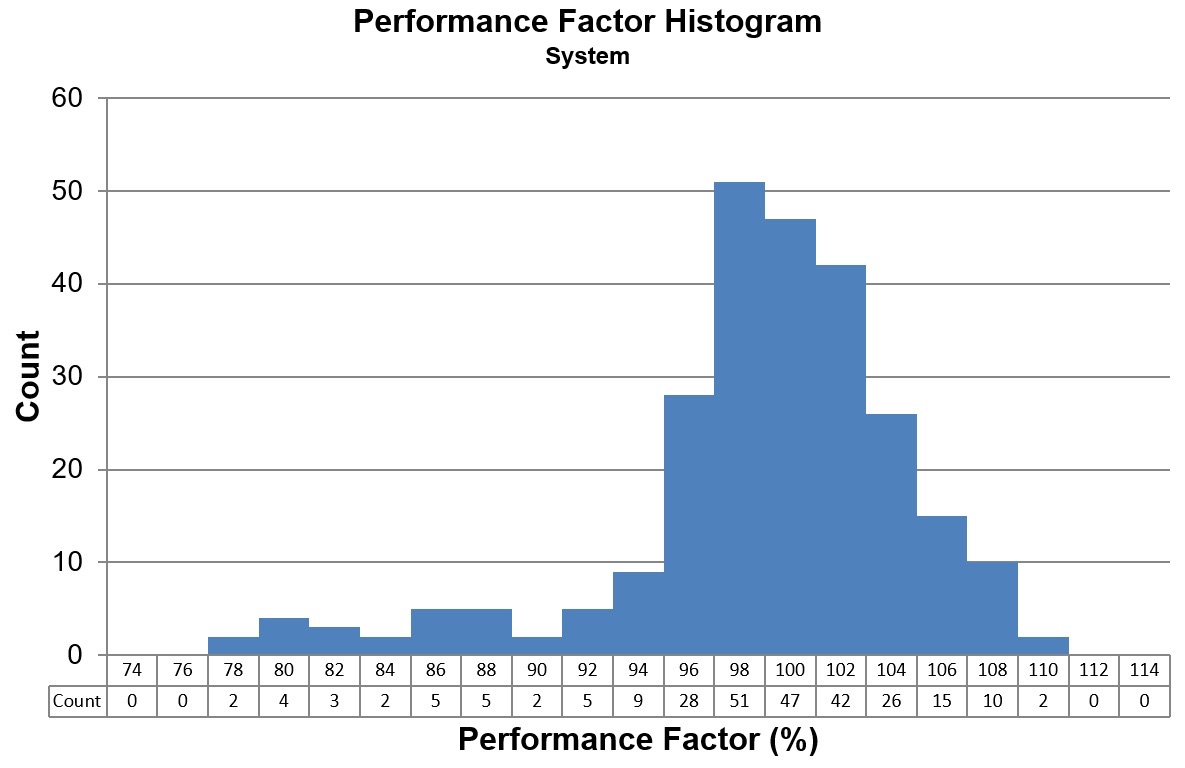
Figure 4--Histogram of Performance Factors
Another useful parameter to plot in histogram form is the Fill Factor (FF). FF is automatically calculated by the curve tracer software - it is defined as Imp times Vmp divided by Isc times Voc, where all values are taken from the measured I-V curve itself. FF is a measure of the "squareness" of the I-V curve. A more-square curve is associated with more efficient production of energy. Comparing FF values across a population of strings is a good way to identify strings that are underperforming, which can be identified by deviations from normal I-V curve shape.
I-V curve tracing is the best way to measure the health of a PV module or string. Looking at populations of I-V curves from different points of view helps uncover problems within the population. Looking at all data views gives a more complete window into the health of the string, and helps zoom in on any underlying issues.
Willard MacDonald is President of Solmetric Corporation, which develops precision test and measurement tools used for field verification applications such as commissioning, O&M, and troubleshooting of PV arrays.
Solmetric Corporation | www.solmetric.com
Author: Willard MacDonald
Volume: 2020 November/December