


Great Expectations: Underperformance in U.S. solar market


For years, the solar industry has believed that utility-scale projects meet expectations. Investors, owners, operators, and developers have been making financial decisions based on the assumption that half of their portfolios will over-perform, to make up for the half that under-performs. Any one project may not be a strong performer, but this is mitigated by divesting across multiple projects. Statistically, with enough projects, an organization should realize the return on investment they expect.
Continued rapid growth is expected in the solar power market. However, the solar energy industry likely can't be sustainable and robust unless power plants consistently achieve their anticipated ROI. In turn, given current competitive market forces, a solar project can't meet its return without an accurate estimate of energy production. This demands that technical, data-driven validations of pre-construction prediction be performed on a regular basis. How can we expect a thriving solar industry if the investment community can't rely on their returns? How can investors rely on their returns without being able to predict how much electricity a project will produce?
A solar power performance study for the U.S. compares initial pre-construction energy estimates to actual project performance for utility-scale solar projects. Publishing these results in an open and transparent manner aims to foster trust between solar project stakeholders across the value chain. The results can offer insight across the clean energy industry, from landowners and project developers, to solar module manufacturers and financial institutions.
Qualification for the validation study
In the United States and Canada, over 10.3 GW of proposed solar power plants have been assessed since 2007. Of the pre-construction projects evaluated, not all were constructed as planned (or even constructed at all.) Ultimately, projects included in the study required a minimum of one year of monthly production data from the U.S. Energy Information Administration (EIA) for comparison purposes, and a bankable pre-construction energy estimate using standard, post-2014 methods.
Current solar project performance database
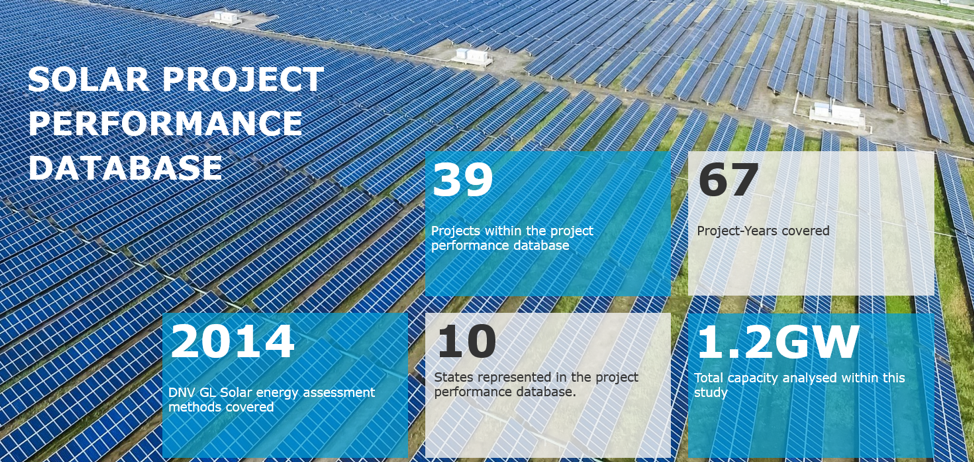
The validation dataset presently has a total installed capacity of 1.2 GW, with 39 U.S. projects from a wide range of geographies, technologies, and vintages. After thoroughly controlling the data for unrealistic overperformance, data quality issues, and misreported energy resulted in minor additional filtering on a project-year basis, the dataset consists of a total of 67 project-years. While the maximum operating years per project is 4.0 years within the filtered dataset, the average is 1.7 operating years per project.
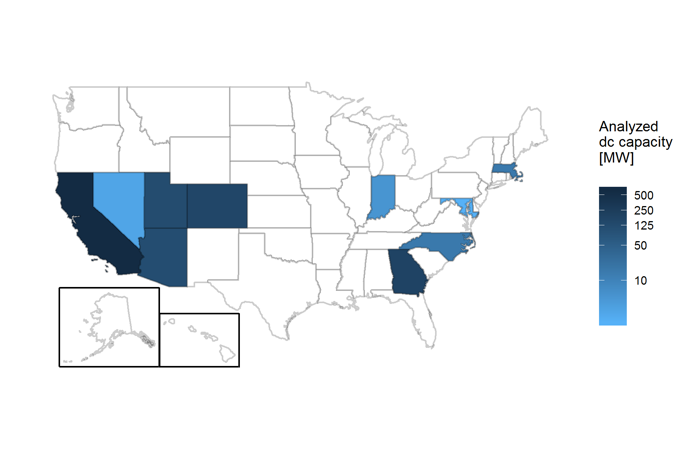
Figure 1: Regional breakdown of solar power projects included in this study
Projects are representative of utility-scale systems across the country with minimum sizes of 1 MW in operation for at least one year. The regional distribution is shown in Figure 1, where the highest capacities are in California and Georgia, at 50.1% (or 613 MW) and 14.9% (or 182 MW) of capacity in the study, respectively. Maryland (0.1%) and Nevada (0.2%) represent the lowest percent of capacity considered. Projects represent a range of sizes from 1 MW - 5 MW to 20 MW - 50 MW to over 100 MW and a mix of fixed tilt and tracker mounting types.
Results of the validation study
This initial solar validation of U.S. operational assets sheds light on the current status of the industry. Across systems within the study, a median performance gap of 3.1 percent was observed on a project basis, while 2.1 percent underperformance was reported on a project-year basis, as seen in Figure 2 and Figure 3, respectively. Interestingly, more data from older projects is included in the project-year results, which could influence these results.
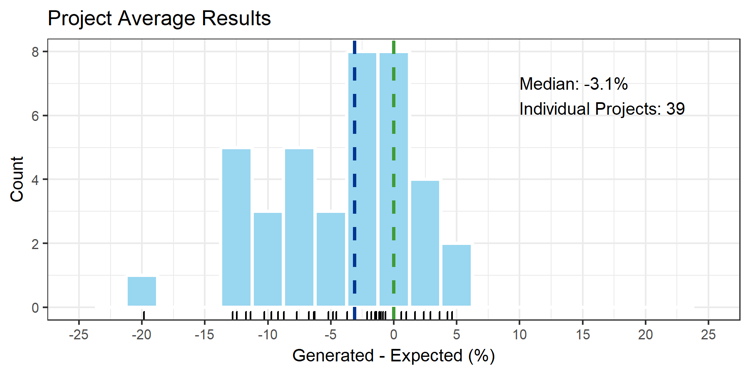
Figure 2: Project-average solar validation results, adjusted for interannual irradiance variability
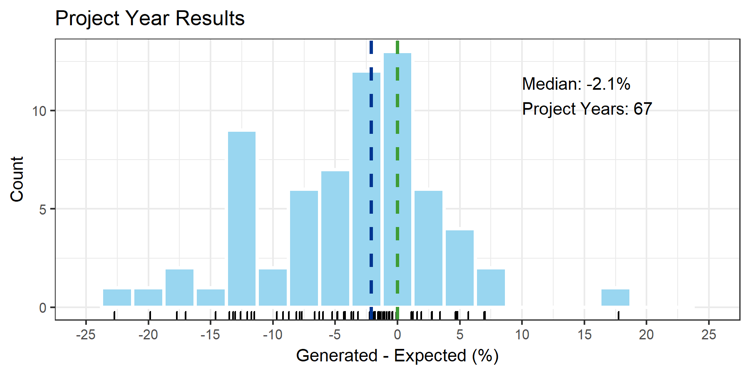
Figure 3: Project-year solar validation results, adjusted for interannual irradiance variability
The study found that, within this limited sample of U.S. projects, assets are performing approximately 3.1 percent below initial predictions from energy assessments performed over the last four years. It is important to consider the uncertainties associated with this validation study, as well as ascertain what could be causing this production gap between pre-construction estimates and post-construction energy production. Could solar resource variability, irradiation data sources, soiling losses, degradation, and availability be contributing to this underperformance?
Resolution and quality of data
Since publicly-available EIA production data was used for operational assets - and is not sufficiently granular - grid availability, plant availability, and curtailment were unknown at the time of this initial study. Force Majeure availability events were not available. Curtailment is not modeled in the pre-construction solar energy assessments, and could not be corrected for in this study due to lack of project-specific curtailment data. Thus, the residual effect of projects with less-severe availability issues or curtailment might not have been detected, and may still be included in the filtered dataset.
EIA production data could not be fully verified for this study. Occasionally, monthly EIA production data was not consistent with values reported in monthly invoices provided directly by the project owners. Annual production, however, was found to be consistent with that of the project owners, and thus relevant to this study. The median project performance of this study can be affected by the number of months removed at the beginning of the life of each project, due to both this variation in the monthly values and prolonged periods where the project many have been under construction (and actively adding capacity). While only the first month of operation was removed, due to lack of project-specific start-up period information, investigating the effect of removing the entire first year of operation can add value to this discussion.
The commissioning process of an asset is critical. Due to start-up issues, project performance in the first year of operation is typically expected to be lower than the next several years. Slightly more than 50 percent of available data (35 project-years) is in the project's first year of operation in this study. Consequently, eliminating this first year has interesting implications on the validation dataset. On a project basis, the validation dataset without this first operating project-year shows a median performance gap of 1.7 percent (Figure 4), 1.4 percent less than the underperformance associated with the first operating project-year included. The median performance gap result on a project-year basis is 1.9 percent (Figure5).
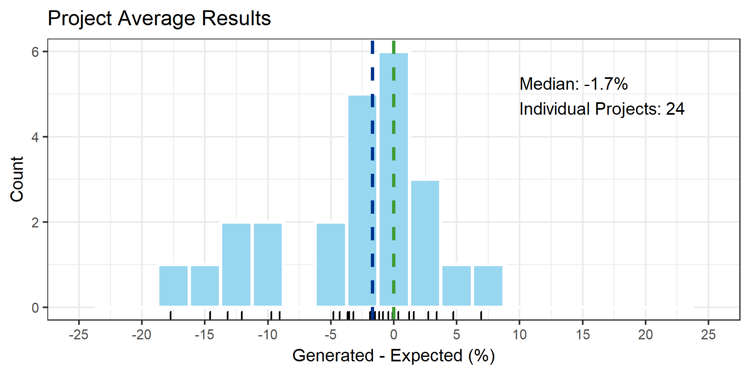
Figure 4: Project-average solar results without Year 1, adjusted for interannual irradiance variability
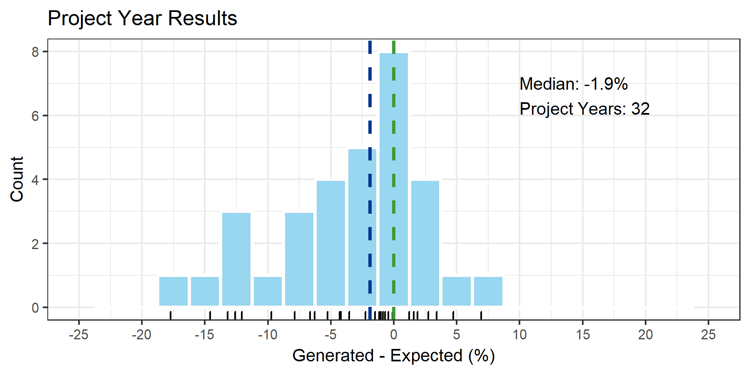
Figure 5: Project-year solar results without Year 1, adjusted for interannual irradiance variability
Need for more performance data
Results may change when additional data become available. With the belief that regularly published validation results may encourage more operators to contribute data to validation, and more independent engineers to publish similar studies, there are plans to update this initial study with additional data on a recurring basis. By collectively evaluating project performance against pre-construction estimates, more accurate energy forecasts and improved uncertainties can reduce the energy production risk for all stakeholders.
Inputs into these models have the potential to be refined. Incorporating a continual stream of higher-resolution data will allow for better interpretation of the performance of these assets in the field. Larger volumes of operational data and measurements facilitate more comparisons of observed project performance relative to their pre-construction energy estimates, allowing for an accurate understanding of the differences between predicted and actual. Particularly given thin margins and aggressive investments in today's US solar market, reducing financial risk is a critical factor in any project, and this introductory study advances a much-needed trend of better transparency in the industry.
Rounak Kharait is solar energy assessment lead in North America for DNV GL, Cory Jog is director of resource assessment for DNV GL, and Emily Ling is an energy analyst for DNV GL. The above-referenced study was released by DNV GL for the overall benefit of the solar industry, and can be found here.
DNV GL | www.dnvgl.com
Author: Cory Jog, Emily Ling, and Rounak Kharait
Volume: 2019 November/December