


What's the difference? SCADA Operational Management vs Performance Management


Utility-scale solar plants require a SCADA system to address the unique challenges of managing PV power generation. Although SCADA systems monitor and control a wide range of devices at sites, they can be even more beneficial when used for performance management to optimize power generation and maximize profits.
It's one thing for a SCADA system to monitor and collect data from all the devices that contribute to generating power. It's another thing to turn that data into actionable information. Is every device that is used to produce power operating as designed? Is the site producing the optimal amount of power? Has the site's power production been curtailed? A SCADA system, when used for performance management in addition to operational management, can answer these questions. This performance-related information enables smart decision-making for both operations and asset management groups.
KPIs and Power Production
The best way to determine at a glance if everything is operating as intended, or if something needs attention, is by reviewing Portfolio Key Performance Indicators (KPIs) (Dashboard 1). The most important statistic is to see how much power is being generated in real time. For large utility-scale sites, power factor and voltage information are additional KPIs that impact a site's real power production.
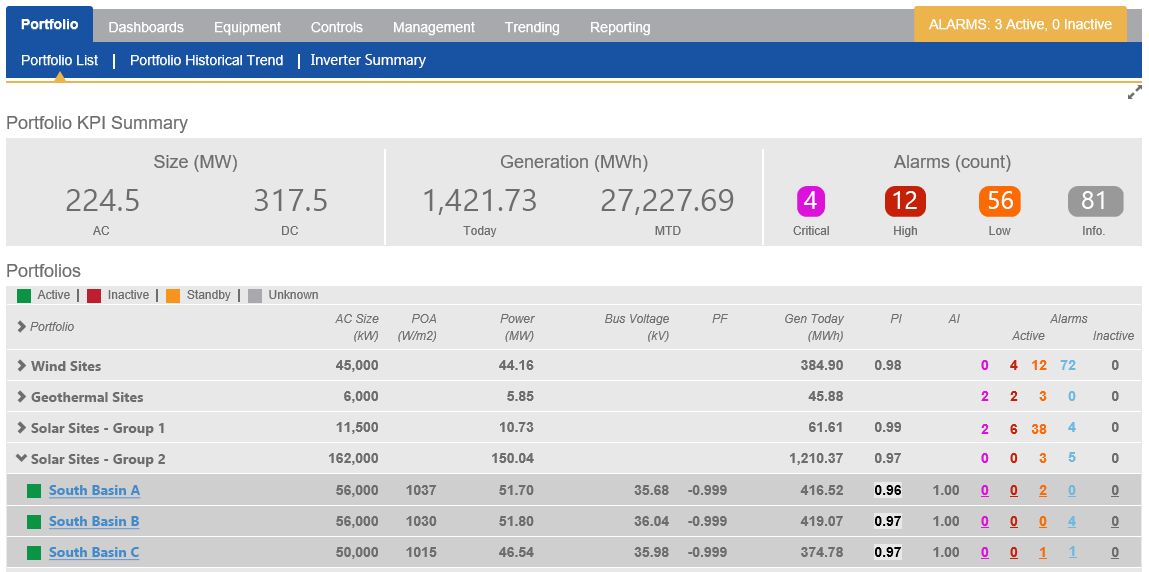
Dashboard 1 - Portfolio-Wide Key Performance Indicators (KPIs)
Beyond those basic indicators, deeper insights can be gained from the Performance Index (PI) and Availability Index (AI) (Dashboard 1 - columns to the left of Alarms). The PI shows if the site is performing at the levels it should be, given the site characteristics. For example, if a 20 MW site is producing 18 MW, is that good or bad, relative to the amount of sun energy available and the equipment conditions? The AI shows whether all of the power-producing devices are available to produce power. At any given point in time, two inverters could be offline, but the site could still be producing the full amount of power. In this case, the PI would be 100 percent, but the AI would only be 90 percent. An operator or engineer can use the KPIs to determine if there is an issue that needs further investigation. By setting alerts on KPI thresholds, staff can be notified when something is adversely impacting the availability or performance indicators.
Looking Further
If a site's PI and AI are not optimal, a staff member may look at the individual devices to determine the contributing factors. For a solar facility, this would mean looking at the inverters, DC strings, and trackers. Operators can use the Portfolio Device Summary - Statusdisplay (Dashboard 2), which graphically displays the real-time generation and status of each site inverter. Additionally, a display can be configured to show the performance index of the inverters (Dashboard 3) so that performance-based issues can be identified.
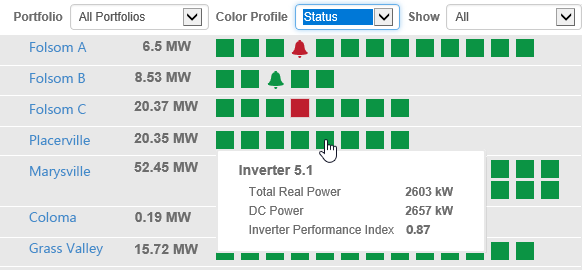
Dashboard 2 - Portfolio Device Summary: Status
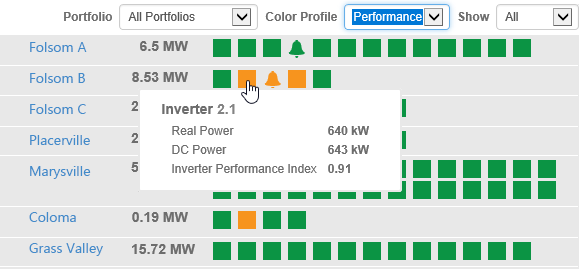
Dashboard 3 - Portfolio Device Summary: Performance
For inverters having performance issues, the DC Current String Trending Performance Index Report (Report 1) can provide detailed information. Whenever the sun is shining, a DC String's performance index should be near 100 percent; a lower value indicates the need to investigate the cause of the reduced performance.
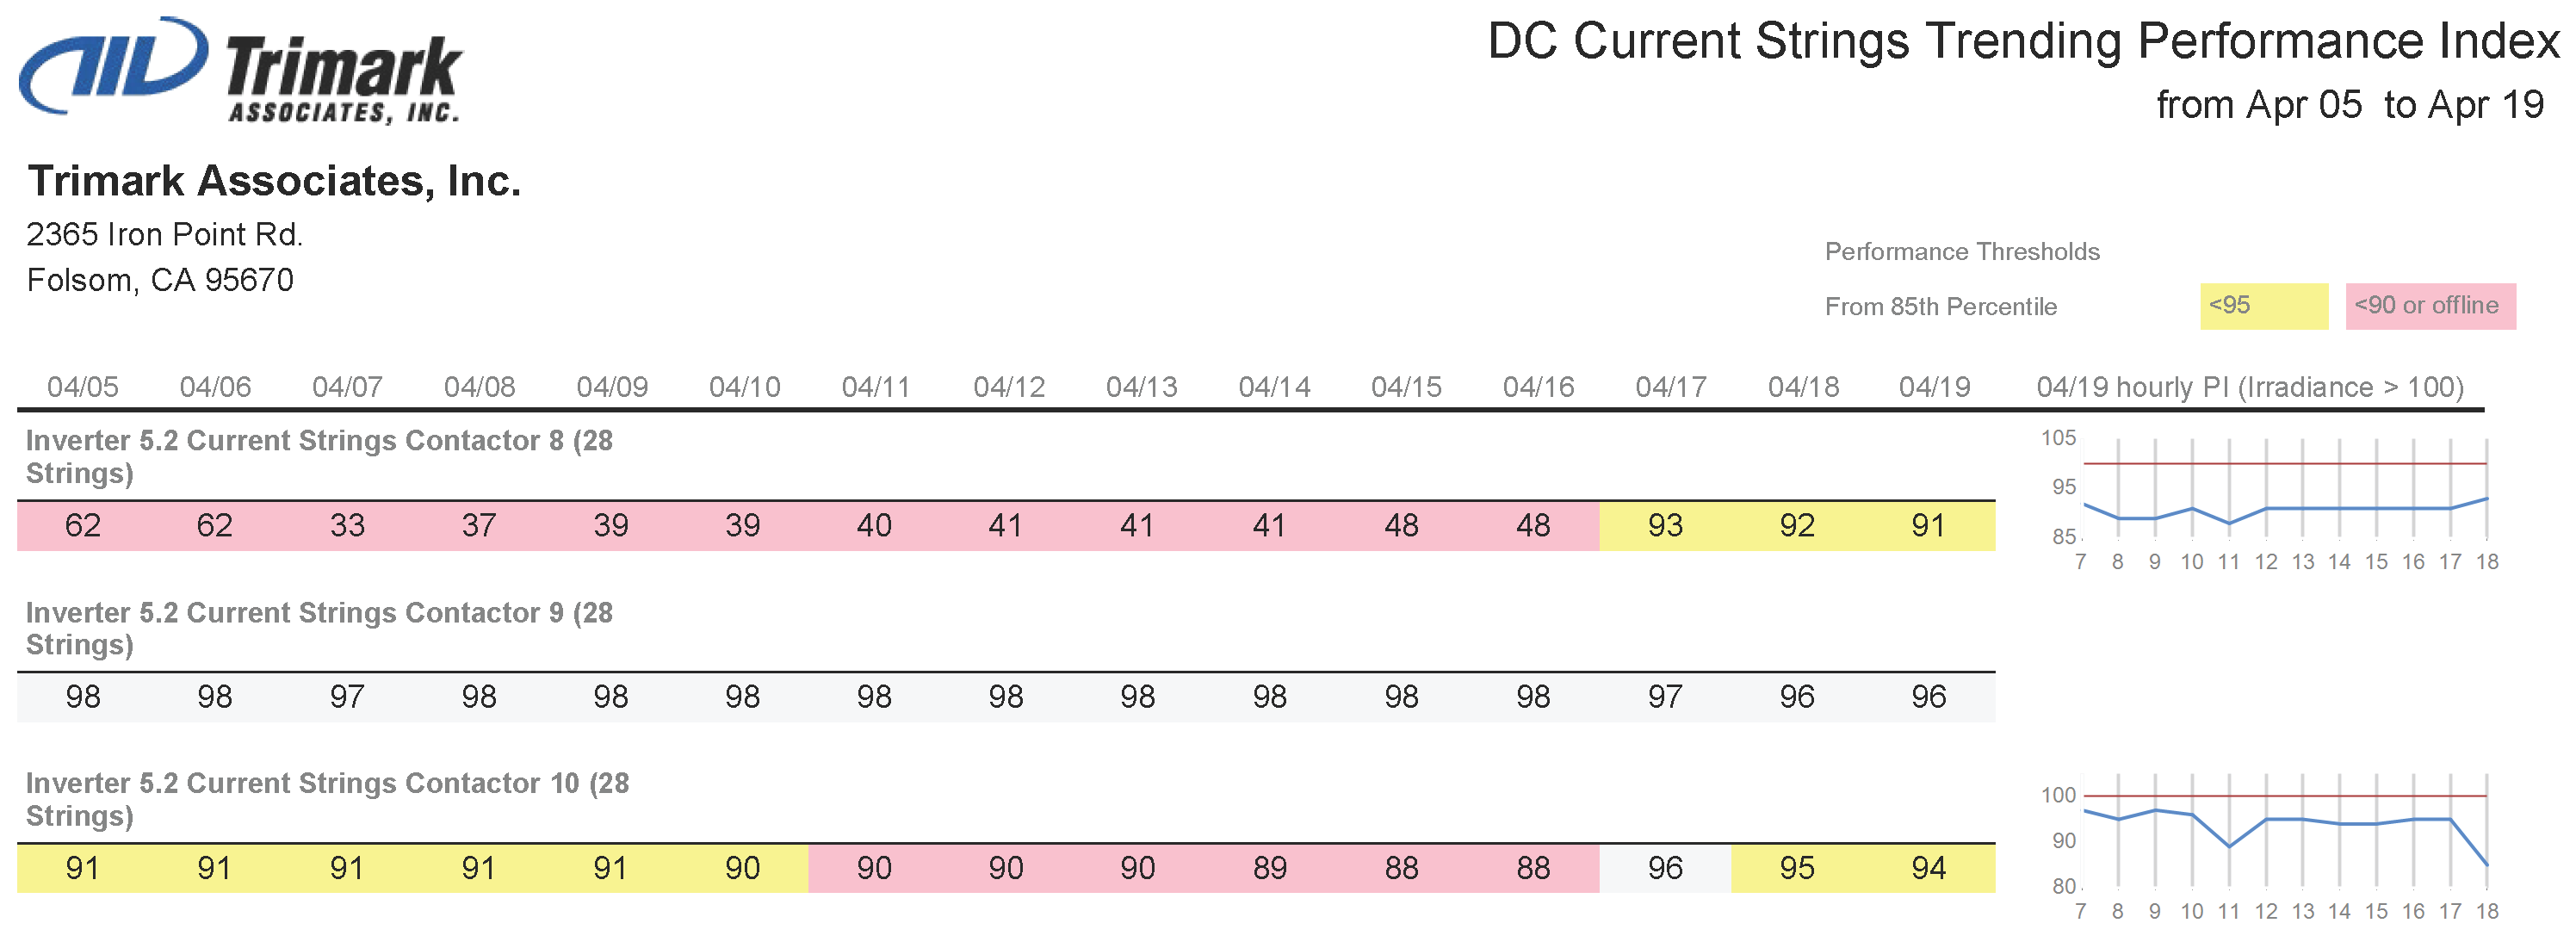
Report 1 - DC Current String Trending Performance Index Report
Trackers can also contribute to poor site performance. Are the trackers positioned optimally - for example, are they accurately following the position of the sun? A Tracker Deviation Report(Report 2) can be used to assess each tracker's operation. Is the tracker at the angle where it should be, and at a similar inclination as other trackers at the site? If there are significant deviations, it could indicate a problem with a tracker drive or controller.
![]()
Report 2 - Tracker Deviation Report
In addition to managing equipment status and performance, attention must be paid to the amount of energy lost due to underperformance. This impact factor can help determine when, and to what extent labor resources should be used to address the problems. If the site's performance is having a marginal impact on the overall energy generation of the site, rolling a truck to resolve the issue may not be worth it; remedial action could instead be combined with the next scheduled maintenance visit. Thresholds can be used to set up alerts as to when the revenue impacts are significant or pervasive enough to require further attention.
Even if all of the equipment is operating as intended, curtailment will impact a site's financial performance. If an Offtaker or Balancing Authority is regulating the maximum amount of power produced at the site, a Curtailment Activity Report(Report 3) can be created. This report is used to identify when power was curtailed, including the source, reason, and duration. In addition to performance analysis, curtailment reconciliation reports can be used to support financial settlements and lost energy reimbursements.
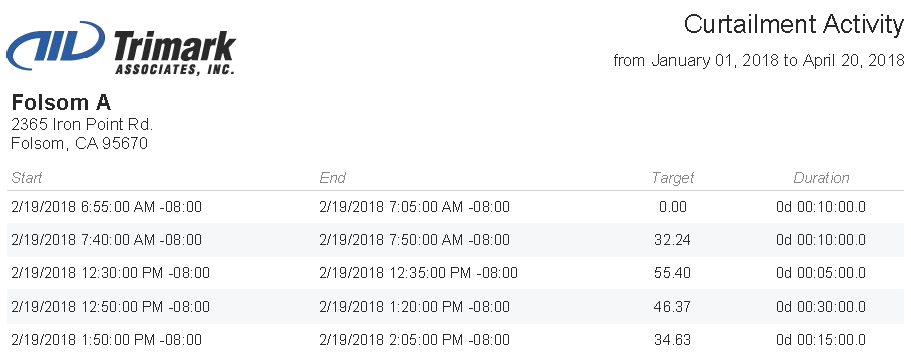
Report 3 - Curtailment Activity Report
Summary
Although a SCADA system enables operators to monitor and control a PV site, the real value of SCADA is in Performance Management. A project's funding is based upon expected financial returns. Performance management ensures that the site performs at those levels, and delivers the expected financial results.
Dean Schoeder is Chief Marketing Officer, BSEE, EIT at Trimark Associates, Inc., a utility-scale PV monitoring provider. Trimark delivers solutions that enable informed energy management, real-time operational control, and complete regulatory compliance. Dean is an engineer with 40 years of industry experience, and an expert in SCADA. He has been responsible for the successful implementation of over $500 million of capital improvements related to controls, systems, networks, metering and security.
Jae Kim is Director of System Integration, Operations and Engineering at Trimark. He is a Certified SCADA Security Architect with more than 25 years of industry experience.
Trimark Associates, Inc. | trimarkassoc.com
Volume: 2018 September/October