

Using GIS Technology to Find Optimal Sites for Utility-scale Solar Generation


For developers of utility-scale solar electric generation, the race gets hotter every day to find ideal locations and meet booming demand for solar power.
By the end of 2016, close to 20,000 megawatts' worth of utility-scale solar photovoltaic projects had been deployed across the United States, according to the Solar Energy Industries Association (SEIA)[1]. Another 20,000 megawatts have been contracted - 8,000 of which is in construction - and a whopping 34,000 megawatts more has been announced, according to SEIA. At peak solar output, that would be enough to power 55 million homes, which is half of the occupied housing in the U.S.
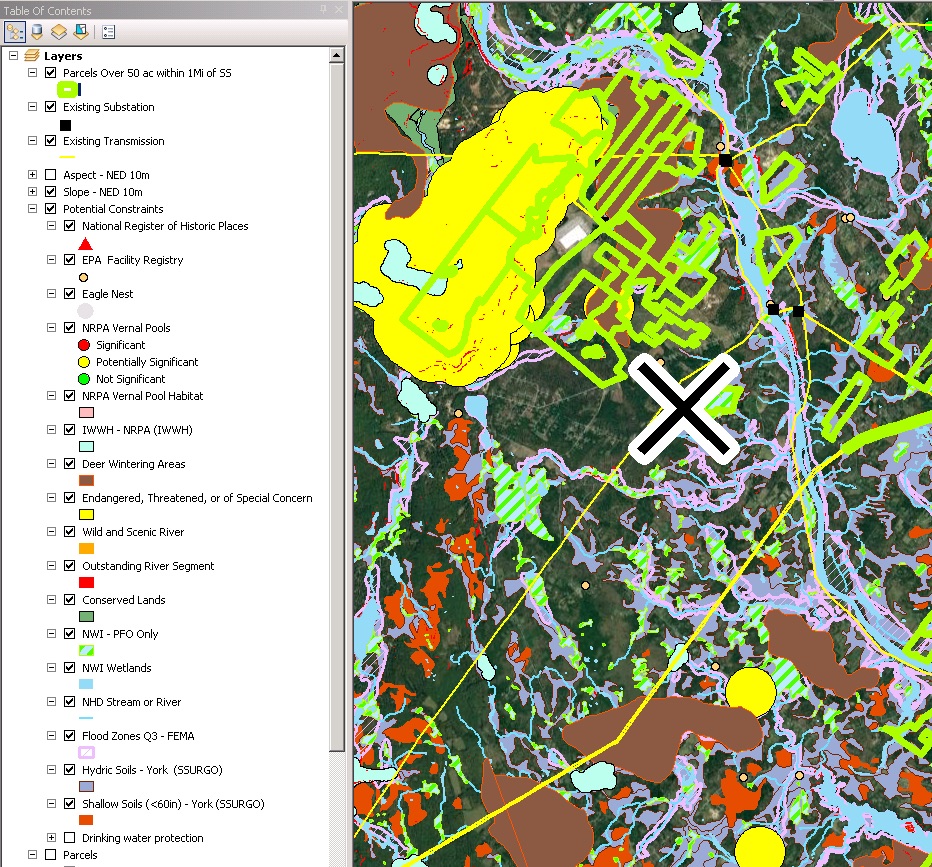
Solar developers today are much like treasure hunters of old. Both use maps marked with an "X" to find their treasure. Luckily, solar developers do not need to rely on drunken pirates to draw their treasure map. Today Geographic Information Systems (GIS) technology marks the spot for utility-scale solar treasure. Powerful GIS mapping tools can rapidly, efficiently, and effectively identify the most feasible locations for solar power and slash the time needed to bring projects online.
When developers look for the best locations for utility-scale solar, they need to consider various site characteristics to ensure that the project is viable, affordable, and can be built without any surprises. Developers are looking for sites that are:
- Large, relatively flat, non-forested upland
- Near existing utility substations and transmission lines that can receive the power generated by the proposed development, without a significant cost to upgrade
- Not within or adjacent to:
- Sensitive habitats
- 100-year-flood zones
- Conservation lands
- Or known cultural resource sites
Until recently, finding suitable locations for utility-scale solar development could take days, or even weeks. Specialists would have to pore over and cross-collate multiple types of maps to identify ideal locations. If any of those maps were out of date, developers risked unpleasant surprises about what they would be able to build, how quickly, and under what level of regulatory review.
Over the last few years, GIS technology and GIS databases have undergone a quantum leap in maturity and comprehensiveness. "Live map" services now get updated weekly, and even daily, as infrastructure, conditions on the ground, and land-use policies and restrictions change. For a developer looking for the best place to site several thousand PV panels and other expensive infrastructure, GIS specialists create interactive "webmaps" that reveal the best locations in just a matter of hours, rather than the days or weeks it could have taken years ago.
Many so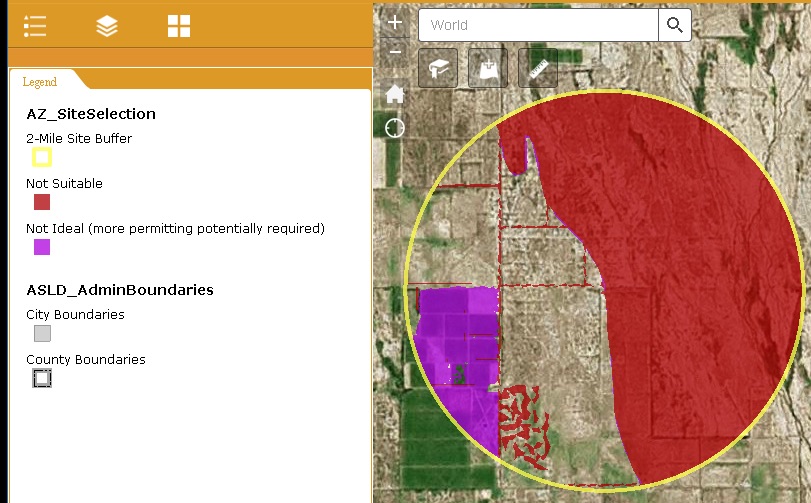 urces of information like the National Wetlands Inventory (NWI), National Hydrography Dataset (NHD), National Flood Hazard Layer (NFHL), Protected Lands of the U.S., the Environmental Protection Agency's Facility Registry Service (FRS), and many others are available as live map services, and easily added to an interactive webmap. When the datasets are updated, one can see those updates in real-time. Unlike working with printed maps in the past, these services allow access to the most reliable and current information.
In general, solar site prospecting is a smart process of elimination. After identifying the town, county, state or other area of interest, GIS Specialists can leverage technology to identify and eliminate all the areas that are defined as not suitable for development. A few examples include areas that are more than two miles away from existing utility infrastructure, wetlands, heavily forested or excessively hilly terrain, sensitive habitat areas, flood zones, and conserved lands.
As each new layer of information is applied to a map, more areas will be ruled out as unsuitable. What remains, and what ultimately gets revealed, are the areas that best meet the project developer's site criteria.
As a developer, be sure to have a conversation with the GIS analyst that clearly defines what information is the most critical. For instance, one of the best ways to find the perfect site is to filter candidate locations first based on interconnection suitability - that is, where does the utility serving the area under study say it can most efficiently accommodate adding the output of a solar farm to the grid? Where are areas with transmission bottlenecks or other potential obstacles to plugging a project into the grid? And as thorough and as regularly updated as today's mapping databases are, there are still plenty of occasions when human intelligence and experience - a seasoned GIS analyst knowing about a land-use restriction or community sensitivity that may not show up on a map - can mean the difference between project success ... and controversy and delays.
Ultimately, beyond helping utility-scale solar developers find the "X" on the treasure map, what skilled GIS experts and GIS technology can do is to prevent unexpected surprises. When you know where the treasure is and there are no surprises, you are positioned to win the race to meet our country's unrelenting demand for more solar power.
 Nate Sylvester, GISP is the National GIS Coordinator of TRC Solutions. He has over 12 years of experience managing GIS systems in the environmental consulting field and extensive experience working with clients to develop solutions for acquisition, management and analysis of geographic data for large projects. Nate is an expert in applying today's GIS technology to all phases of a project, from the early planning stages all the way through post-construction monitoring.
TRC Solutions | www.trcsolutions.com
[1] "Utility-scale" refers to the size of projects and who buys the power: utilities or wholesale energy providers, not individual customers generating electricity from their rooftops or fields.
Volume: 2017 March/April