
Page 17 - North American Clean Energy November December 2019 Issue
P. 17
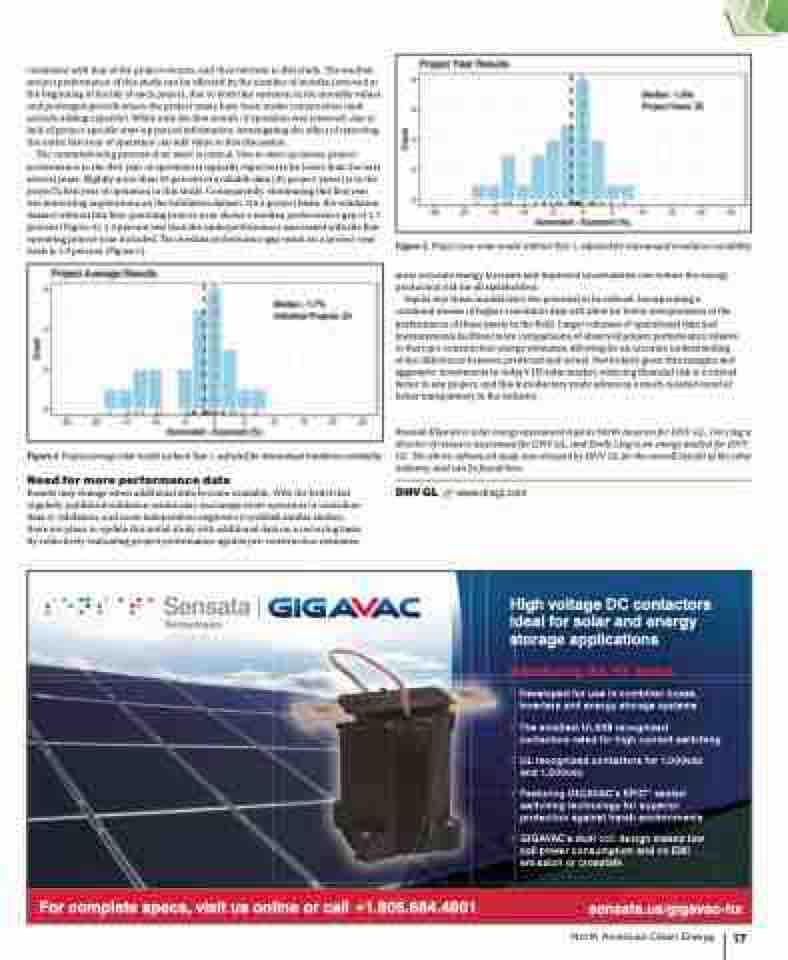
Figure 5. Project-year solar results without Year 1, adjusted for interannual irradiance variability more accurate energy forecasts and improved uncertainties can reduce the energy production risk for all stakeholders. Inputs into these models have the potential to be refined. Incorporating a continual stream of higher-resolution data will allow for better interpretation of the performance of these assets in the field. Larger volumes of operational data and measurements facilitate more comparisons of observed project performance relative to their pre-construction energy estimates, allowing for an accurate understanding of the differences between predicted and actual. Particularly given thin margins and aggressive investments in today’s US solar market, reducing financial risk is a critical factor in any project, and this introductory study advances a much-needed trend of better transparency in the industry. Rounak Kharait is solar energy assessment lead in North America for DNV GL, Cory Jog is director of resource assessment for DNV GL, and Emily Ling is an energy analyst for DNV GL. The above-referenced study was released by DNV GL for the overall benefit of the solar industry, and can be found here. DNV GL /// www.dnvgl.com consistent with that of the project owners, and thus relevant to this study. The median project performance of this study can be affected by the number of months removed at the beginning of the life of each project, due to both this variation in the monthly values and prolonged periods where the project many have been under construction (and actively adding capacity). While only the first month of operation was removed, due to lack of project-specific start-up period information, investigating the effect of removing the entire first year of operation can add value to this discussion. The commissioning process of an asset is critical. Due to start-up issues, project performance in the first year of operation is typically expected to be lower than the next several years. Slightly more than 50 percent of available data (35 project-years) is in the project’s first year of operation in this study. Consequently, eliminating this first year has interesting implications on the validation dataset. On a project basis, the validation dataset without this first operating project-year shows a median performance gap of 1.7 percent (Figure 4), 1.4 percent less than the underperformance associated with the first operating project-year included. The median performance gap result on a project-year basis is 1.9 percent (Figure 5). Figure 4. Project-average solar results without Year 1, adjusted for interannual irradiance variability Need for more performance data Results may change when additional data become available. With the belief that regularly published validation results may encourage more operators to contribute data to validation, and more independent engineers to publish similar studies, there are plans to update this initial study with additional data on a recurring basis. By collectively evaluating project performance against pre-construction estimates, High voltage DC contactors ideal for solar and energy storage applications Introducing the HX Series Developed for use in combiner boxes, inverters and energy storage systems The smallest UL508 recognized contactors rated for high current switching UL recognized contactors for 1,000vdc and 1,500vdc Featuring GIGAVAC’s EPIC® sealed switching technology for superior protection against harsh environments GIGAVAC’s dual coil design means low coil power consumption and no EMI emission or crosstalk For complete specs, visit us online or call +1.805.684.4801 sensata.us/gigavac-hx North American Clean Energy 17
