
Page 16 - North American Clean Energy November December 2019 Issue
P. 16
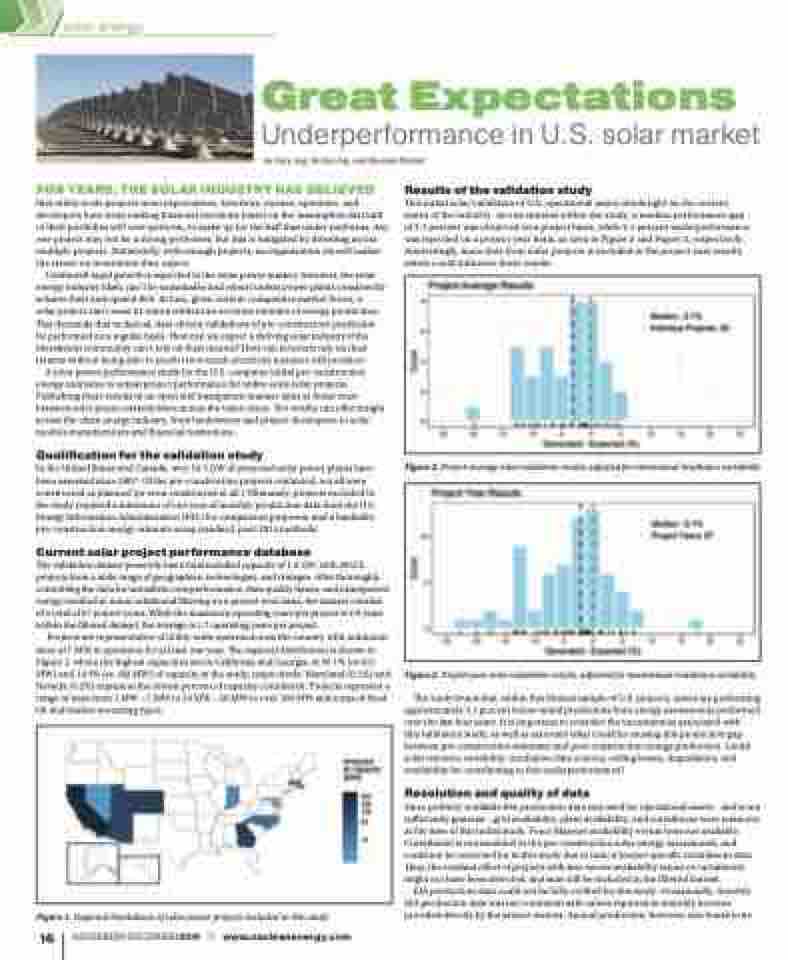
solar energy FOR YEARS, THE SOLAR INDUSTRY HAS BELIEVED that utility-scale projects meet expectations. Investors, owners, operators, and developers have been making financial decisions based on the assumption that half of their portfolios will over-perform, to make up for the half that under-performs. Any one project may not be a strong performer, but this is mitigated by divesting across multiple projects. Statistically, with enough projects, an organization should realize the return on investment they expect. Continued rapid growth is expected in the solar power market. However, the solar energy industry likely can’t be sustainable and robust unless power plants consistently achieve their anticipated ROI. In turn, given current competitive market forces, a solar project can’t meet its return without an accurate estimate of energy production. This demands that technical, data-driven validations of pre-construction prediction be performed on a regular basis. How can we expect a thriving solar industry if the investment community can’t rely on their returns? How can investors rely on their returns without being able to predict how much electricity a project will produce? A solar power performance study for the U.S. compares initial pre-construction energy estimates to actual project performance for utility-scale solar projects. Publishing these results in an open and transparent manner aims to foster trust between solar project stakeholders across the value chain. The results can offer insight across the clean energy industry, from landowners and project developers, to solar module manufacturers and financial institutions. Qualification for the validation study In the United States and Canada, over 10.3 GW of proposed solar power plants have been assessed since 2007. Of the pre-construction projects evaluated, not all were constructed as planned (or even constructed at all.) Ultimately, projects included in the study required a minimum of one year of monthly production data from the U.S. Energy Information Administration (EIA) for comparison purposes, and a bankable pre-construction energy estimate using standard, post-2014 methods. Current solar project performance database The validation dataset presently has a total installed capacity of 1.2 GW, with 39 U.S. projects from a wide range of geographies, technologies, and vintages. After thoroughly controlling the data for unrealistic overperformance, data quality issues, and misreported energy resulted in minor additional filtering on a project-year basis, the dataset consists of a total of 67 project-years. While the maximum operating years per project is 4.0 years within the filtered dataset, the average is 1.7 operating years per project. Projects are representative of utility-scale systems across the country with minimum sizes of 1 MW in operation for at least one year. The regional distribution is shown in Figure 1, where the highest capacities are in California and Georgia, at 50.1% (or 613 MW) and 14.9% (or 182 MW) of capacity in the study, respectively. Maryland (0.1%) and Nevada (0.2%) represent the lowest percent of capacity considered. Projects represent a range of sizes from 1 MW – 5 MW to 20 MW – 50 MW to over 100 MW and a mix of fixed tilt and tracker mounting types. Results of the validation study This initial solar validation of U.S. operational assets sheds light on the current status of the industry. Across systems within the study, a median performance gap of 3.1 percent was observed on a project basis, while 2.1 percent underperformance was reported on a project-year basis, as seen in Figure 2 and Figure 3, respectively. Interestingly, more data from older projects is included in the project-year results, which could influence these results. The study found that, within this limited sample of U.S. projects, assets are performing approximately 3.1 percent below initial predictions from energy assessments performed over the last four years. It is important to consider the uncertainties associated with this validation study, as well as ascertain what could be causing this production gap between pre-construction estimates and post-construction energy production. Could solar resource variability, irradiation data sources, soiling losses, degradation, and availability be contributing to this underperformance? Resolution and quality of data Since publicly-available EIA production data was used for operational assets - and is not sufficiently granular - grid availability, plant availability, and curtailment were unknown at the time of this initial study. Force Majeure availability events were not available. Curtailment is not modeled in the pre-construction solar energy assessments, and could not be corrected for in this study due to lack of project-specific curtailment data. Thus, the residual effect of projects with less-severe availability issues or curtailment might not have been detected, and may still be included in the filtered dataset. EIA production data could not be fully verified for this study. Occasionally, monthly EIA production data was not consistent with values reported in monthly invoices provided directly by the project owners. Annual production, however, was found to be Great Expectations Underperformance in U.S. solar market by Cory Jog, Emily Ling, and Rounak Kharait Figure 2. Project-average solar validation results, adjusted for interannual irradiance variability Figure 3. Project-year solar validation results, adjusted for interannual irradiance variability Figure 1. Regional breakdown of solar power projects included in this study 16 NOVEMBER•DECEMBER2019 /// www.nacleanenergy.com
