Page 34 - North American Clean Energy September October 2015
P. 34
wind power
Moving Towards a New Normal
Making sense of a changing distributed wind market
by Nik Foster
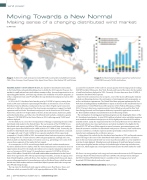
Image 1: In 2014, U.S. small wind exports totaled $60 million and markets included Brazil, Canada, Image 2: Distributed wind cumulative capacity has reached a total
Chile, China, Germany, Grand Cayman, Italy, Japan, Korea, Mexico, New Zealand, UK, and Vietnam. of 906 MW from nearly 74,000 wind turbines.
REACHING ALMOST 1 GW OF CAPACITY IN 2014, the market for distributed wind turbines
accounted for nearly 55% of the total U.S. annual capacity with two large projects totaling
in the United States rebounded by adding close to double the 2013 capacity. However, the 34.8 MW installed. Minnesota, New York, Nevada, and Iowa led the nation for the number
market for small and mid-size sized turbines remains in lux. Increased opportunities in an of small wind turbines deployed in 2014. Currently, 16 states have more than 10 MW of
expanding global market, new inancing schemes, the availability of incentive programs, as cumulative distributed wind capacity.
well as competition from solar PV will afect the way distributed wind projects fare in 2015 Apart from the continued success in exports, some of the factors afecting the industry
and beyond.
include new inancing schemes, the continuation of existing grant and loan programs, as
In 2014, the U.S. distributed wind market grew by 63.6 MW of capacity coming from well as certiication requirements. he United Wind lease program implemented in New
nearly 1,700 units (turbines) representing $170 million in investment across 24 states. York State is leading industry stakeholders to expect an increase in the small wind sector’s
Distributed wind is deined as wind projects that are either of-grid or grid-connected, competitiveness. United Wind inanced ive projects in New York in 2014 and, as of May
and serve to ofset all or a portion of the local energy consumption or support local grid 2015, 27 projects have been commissioned per United Wind records and the New York
operations and local loads. Distributed wind projects can be found across all 50 states, State Energy Research and Development Authority reported 40 applications received so
Puerto Rico, and the U.S. Virgin Islands at homes, farms and ranches, businesses, public far. hese numbers indicate increased interest in new inancing models.
and industrial facilities, and other sites. Distributed wind reached a cumulative capacity he continuation of existing grant and loan programs are also shaping the future of the
of almost 1 GW (906 MW) in the United States in 2014, relecting nearly 74,000 wind U.S. distributed wind market. In total, $20.4 million in federal, state, and utility incentives
turbines deployed.
were awarded to distributed wind projects in 2014, slightly more than the $15.4 million
For the third year in a row, the U.S. Department of Energy is examining the state of the awarded in 2013. Lastly, the requirement by the U.S. Internal Revenue Service (IRS) that
distributed wind market in the United States. he vast majority of the 63.6 MW of new small wind turbines must meet performance and safety standards to be eligible for the
distributed wind capacity installed in 2014 came from projects with large-scale turbines, federal 30% ITC will most likely support increased consumer, government agency, and
which grew almost threefold from 20.4 MW in 2013 to 57.5 MW in 2014. Conversely, the inancial institution conidence in distributed wind projects. However, while certiication
markets for distributed wind systems using small and mid-sized wind turbines continued increases conidence, it will also represent another potentially costly investment for
to struggle with only 3.7 and 2.4 MW of new capacity installed in 2014, respectively, manufacturers undergoing the certiication process.
compared to 5.6 and 4.4 MW in 2013. Inconsistent federal and state incentives, including Looking ahead, the outlook for the distributed wind market in 2015 and beyond remains
the ending of the U.S. Treasury Section 1603 cash grant payments, and high soft costs, mixed. he large-scale sector of the distributed wind market is expected to continue to
which include non-hardware balance-of-system costs (e.g., permitting), were some of the grow in the near future and the mid-size sector may rebound, albeit on a very small level
reasons these segments of the market did not expand.
in terms of units deployed. Manufacturers and developers of small wind projects remain
As a consequence, in 2014, several foreign-based small scale turbine manufacturers reliant upon the global market and hope for breakthroughs in inancing and reductions
started to abandon the U.S. market, while U.S.-based manufacturers continued to focus on in soft cost, which might inject some upward momentum into the 2015 market for small
opportunities abroad. For the small scale turbine sector, exports remained an important wind.
source of revenue in 2014. Seven U.S. manufacturers exported 11.2 MW in 2014, at a
value of $60 million. Nearly 80% of all small wind turbines manufactured in the United Nik Foster is an energy analyst in the energy and environment directorate at the US Department
States were exported in 2014. he top reported export markets, in terms of capacity, were of Energy’s Paciic Northwest National Laboratory (PNNL). he US Department of Energy’s
Italy, United Kingdom, and South Korea. New markets, including South Korea and Japan, full 2014 Distributed Wind Market Report is available at http://energy.gov/eere/wind/
are providing opportunities for manufacturers such as Northern Power, which has made downloads/2014-distributed-wind-market-report
inroads into these markets with new wind-diesel hybrid systems which also incorporate
solar PV and energy storage.
Paciic Northwest National Laboratory | www.pnnl.gov
he top states for distributed wind capacity additions were New Mexico, Texas, and
California, which accounted for 88% of all capacity additions in 2014. New Mexico
34
SEPTEMBER/OCTOBER 2015 nacleanenergy.com