Page 18 - North American Clean Energy March April 2015
P. 18
wind power
Taming the Cold
Turbine blades brave icing conditions
By Matthew Wadham-Gagnon, Caroline Farley & Bruno Boucher
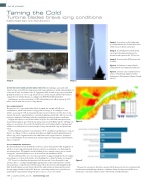
Image 1. Ice accretion on the leading edge
of a turbine blade at the TechnoCentre ́olien
(TCE) test site in Rivìre-au-Renard
Image 1.
Image 2. Ice shedding from a blade during
a de-icing trial using a prototype electro-
thermal retroit system at the TCE test site
Image 3. Snowcat and a 4WD pick-up truck
on tracks
Figure 1. Preliminary ice map of Quebec,
produced by VTT in collaboration with TCE
Figure 2. Greatest causes of production loss
(Source: “Wind Energy Update’s Turbine
Optimization, Maintenance & Repair Canada
Survey”)
Image 3.
Image 2.
WITHIN THE NORTH AMERICAN WIND ENERGY INDUSTRY, the challenges associated with
climates characterized by low temperatures and icing conditions are widely acknowledged. As
of the end of 2012, two-thirds of the 11.5 gigawatts (GW) of wind energy capacity installed
globally in moderate to severe icing climates were located in Canada and the United States,
compared to one third in Europe (according to the BTM World Market Update).
Furthermore, it is forecasted that 5.9 GW of North America’s added capacity by 2017
will be sited in moderate to severe icing climates.
Ice assessment
he presence of ice on a wind turbine blade, if signiicant enough, will afect its
aerodynamics, which leads to lower energy yield (see Image 1). According to Lacroix
(2012), an average of 7.5% of annual production was lost in Quebec in 2011 due to icing
climate. he Quebec wind industry is, currently, deploying considerable efort to overcome
various technological challenges related to wind plant operation in winter conditions.
In light of the most recent call for tenders in Quebec for a 450 MW wind power farm,
Figure 1.
many industry players agree that the upcoming contracts with Hydro-Qúbec will hinge on
proper ice assessment. As a result, the industry is keen on having reliable icing maps and
validated correlations between meteorological icing, instrumental icing, and production
losses.
In 2014, Finland’s national research institute, VTT*, established a preliminary ice map of
Quebec (see Figure 1). his ice map has already proven highly useful in pinpointing areas
where icing can be a signiicant issue for wind farms in the region. However, to improve
the overall reliability of such information, further long-term climatological and wind farm
data are required.
Ice protection systems
he wind industry has also identiied a need for ice protection systems (IPS). Regardless of
whether or not icing-related production losses have been estimated correctly during the
assessment phase, IPS might be worth including. In fact, anytime icing occurs at a wind
energy site, a potential business case can be made for the installation of IPS.
he idea behind an IPS is to recover all or part of the energy potentially lost due to icing by
preventing ice accretion on the blades, or by shedding the ice from the blades (see Image 2).
IPS’ closest to technological maturity include hot-air and electro-thermal de-icing Figure 2.
systems. Anti-ice coatings, though highly appealing due to their potential low-cost and
low-maintenance requirements, still must prove their efectiveness and durability in the
ield. Retroit options are much more limited for wind turbines in operation that aren’t he general consensus is that these systems still lack a proven track record and would
already equipped with a built-in IPS. However, some independent service providers are beneit from standardized performance validation. Many developers would like to see
proposing de-icing solutions using helicopters, rope access, or even robots.
performance warranties similar to those ofered with a standard turbine.
18 nacleanenergy.com
MARCH/APRIL 2015