Page 20 - North American Clean Energy July August 2015
P. 20
solar energy
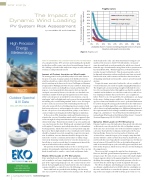
Fragility curves
50%
y)
The Impact of 45% cit
moderate strength design
ess pa
40% tr ca
High strength design
Dynamic Wind Loading
35% e sger
ablhi
low strength design
30%
w->
PV System Risk Assessment llo --
25%
g aes
20% inrti
by Colleen O’Brien, P.E. and Dr. David Banks
edpe
15% xcepro
eal
10%
onur
5% ctict
fratru
0%
Y: m s
0% 5%
10% 15% 20%
25% 30%
35% 40%
o
Fr
probability that [Y = fraction exceeding allowable stress] in 25 years
Based on wind speed recurrence data
Figure 1: Fragility curve
PART OF DETERMINING THE LONGEVITY AND RETURN ON INVESTMENT
of the loads in the codes come from wind tunnel testing of scale
of a solar photovoltaic (PV) system is understanding the probabil- models of the structures. ASCE 7-16 will introduce new provi-
ity that there will be repair costs related to wind damage. Some of sions for wind loads on roof-mounted solar, which were derived
the challenges related to this analysis are unique to solar, and some from this type of wind tunnel testing. Most of these provisions are
of them are still poorly understood.
based on SEAOC PV2, “Wind Design For Low-Proile Solar Pho-
tovoltaic Arrays On Flat Roofs”. his document provides a lot of
Impact of Project Location on Wind Loads
background information on how wind loads vary from one instal-
he starting point for such a probability analysis is the wind climate at lation to the next, and is a must-read for those interested in un-
the project’s location. A regional analysis of the likelihood of extreme derstanding wind loads on low-proile, commercial roof-mounted
winds has already been conducted for all of the USA, and is incorporated systems.
into the wind map in the American Society of Civil Engineers Minimum Despite the name, most static loads in the code are actually of
Design Loads for Buildings and Other Structures (ASCE 7). Similar maps very brief duration, the result of rapidly changing luid dynamics.
exist in most countries, including Mexico, Canada, and Australia. hese he design loads can last just long enough to fully load the struc-
ISO17025
maps are created using wind data from airports, which are typically ture. For roof-mounted solar, this might mean that the weight of
enveloped conservatively. However, it is often the case that little or no a module and its ballast is exceeded for a tenth of a second or less.
wind data is available from the sparsely populated areas where many It is tempting to dismiss this as too brief to cause a signiicant
utility-scale solar projects are installed. In some situations, a “special failure. However, once the panel lifts, the aerodynamics can change
wind region” with locally high winds can be present, but not quantiied in for the worse, leading to more uplift force. For this reason, aver-
the building code, or wind loading standard. In these cases, the designer age forces from tests should never be used – peak wind loads must
needs to conduct an assessment of the wind loading risk. his may in- be used for design. Measuring peak wind loads in the wind tunnel
clude a discussion with the local building department, analysis of wind requires speciically designed data acquisition systems which can
data from nearby sources, and investigation for evidence of high winds at collect data at very high sampling rates. Additional information of
the site – the presence of a nearby wind farm, perhaps, or anecdotal ac- the requirements for such testing is available in industry literature.
counts of empty trucks being knocked of the highway on windy days.
(Kopp, G.A., and Banks, D. “Use of Wind Tunnel Test Method for Ob-
In the western USA, downslope winds and thunderstorms are
taining Design Wind Loads on Roof-Mounted Solar Arrays”. Journal of
of particular concern. Downslope winds, which can approach hur- Structural Engineering 139 (2) (2013): 284-287)
ricane strength, develop in mountainous regions with a steep lee
(down-wind) slope. hunderstorm winds rise up very quickly, and Dynamic Wind Loads on PV Structures
can come from any direction. Wind speeds can jump from 20 mph Dynamic loads increase the loads above those predicted with static
to 60 mph in 2-3 minutes, particularly when there is a downburst. coeicients because they include the efect of rhythmic motion
Tracking systems, which often move to a stow position (typically of the structure on the loads. One of the best known examples of
lat or near lat) in high winds to reduce wind loads on the system, a structure that failed due to dynamic wind loads is the Tacoma
should be designed to provide enough time to get into stow posi- Narrows Bridge. Every structure has modes of vibration, and
tion. In addition, stow mechanisms should be designed to func- each mode has a natural frequency. For example, many ixed-tilt
tion in the event of a communications failure or utility outage. systems will have a mode in which they sway back and forth, in a
Conversely, downslope winds tend to be very directional and can north-south direction. Typically, the natural frequency for this mo-
last all day, or even for several days. It is important to know if the tion is between 2 Hz and 5 Hz. If the rack is bufeted by gusts of
system is vulnerable to these wind directions.
wind at its natural frequency, the rack will begin to sway back and
he question of vulnerability leads us to the second step in the forth at this frequency, which in turn, will cause inertial loading on
analysis: determining the wind loads on the structure. here are two the support posts.
kinds of wind loads to consider – static loads and dynamic loads.
here is very little energy in the wind at these frequencies.
However, ixed-tilt, ground-mounted systems are generally built
Static Wind Loads on PV Structures
in large arrays. he rows of racks create wakes with smaller, higher
Static wind loads on the structure and on smaller components, frequency gusts relative to the approaching low, due to vortex
such as modules and connecting hardware, must be determined as shedding. Interestingly, this is particularly pronounced in the sec-
part of the engineering design process. Once static loads are deter- ond row from the north edge in south-facing ixed-tilt arrays.
mined, the load ampliication, if any, from the structure’s dynamic he efects of dynamic wind loading are sometimes expressed
response should be accounted for (see the following section).
as a dynamic ampliication factor (DAF), which is a multiplier on
Static wind loads are provided in the building code for many the static wind loads to account for the dynamic or inertial load-
structures, but PV is not yet addressed in existing codes. Nearly all
ing. As the name implies, the DAF is always greater than 1.0. In
20
JULY/AUGUST 2015
nacleanenergy.com