
Page 18 - North American Clean Energy January/February 2019 Issue
P. 18
wind power
What’s in a guarantee?
by Nicolás Rossel and Lyndsey Shuckerow
THE WIND O&M INDUSTRY, LIKE MOST SERVICE INDUSTRIES, has a long (and sometimes checkered) history with guarantees. Wind guarantees can be notoriously di cult to understand and navigate; as the industry moves forward with increasing technological and nancial sophistication, the guarantees that back the projects need to keep pace. Ultimately, each project contract is unique, and requires a granular-level understanding of its ne print. Nevertheless, with a general framework for understanding the di erent types of risks that underlie a project, and the guarantees that are available to mitigate those risks, owners can make informed decisions in this increasingly sophisticated environment.
e key is to understand a project or eet’s risk drivers. A breakdown of these risks helps an owner determine which they are positioned to take on themselves, and which require guarantee coverage.
Perhaps the most obvious is Resource Risk: will the wind blow? is can be di cult to gauge, especially given signi cant annual variability, and the fact that O&M providers have been reluctant to take on risks they can’t adequately de ne. However, this is likely to change as certain service providers are able to leverage internal or external resource assessment expertise.
Even more complex is Market and Regulatory Risk. Market risk can include basis risk, curtailment, and anything that may impact project cash ow. Regulatory risk includes the ever-present particularities around taxes and tax credits, environmental issues, NERC regulations, and a whole host of others.
Perhaps the most relevant risk in the O&M world is Performance Risk, which
is further broken down into Failure vs Degradation Risk. Failure risk refers to unexpected, and generally catastrophic events that can bring down a plant, or at least a signi cant portion of it. is includes major component and substation failures, as well as serial defects that have the same impact. Degradation can include power curve issues and blade deterioration. Performance issues are the traditional territory of O&M service providers, but, more and more, they are being asked to cover other areas of risk.
Given these underlying risk drivers, let’s lay out a framework of guarantees that take on increasing levels of risk:
• Time-based Availability Guarantee: Based on the number of hours a site is online compared to the number of hours a site was expected to be online.
• Performance Guarantee: Based on the actual performance of a site compared to the resource-adjusted expected performance of a site.
• Energy (or Yield) Guarantee: Based on the actual performance of a site compared to the expected performance of a site, with no adjustment for actual resource.
• Revenue Guarantee: Based on the actual revenue from a site compared to the expected revenue.
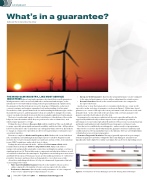
Another way to view the framework is to visualize which risks an Owner is still exposed to under each type of guarantee, as shown in Figure 1. With a time-based guarantee, an Owner is still exposed to most performance risk, all resource risk, and all market risk. On the other end of the spectrum, with a revenue guarantee, the guarantee provider holds almost all of the risk.
As guarantees become more sophisticated, the service provider will need to be supported by additional subject matter experts. Service providers specialize in performance; resource risk is typically well understood by a resource assessment group; and market and regulatory risk is handled by asset managers or a nance team.
Now that you’ve established your risk appetite - and are ready to sign a guarantee
- what else do you need to know? Unfortunately, guarantee structures and terms and conditions have not been standardized across the industry. Here are a few helpful hints to think about as you review your guarantee.
Guarantee Target and Calculation: e target (generally expressed as a percentage)
is what your guarantee provider is obligated to hit (or pay damages). Guarantees are typically in the mid to high 90s for utility-scale plants, but can be lower, depending on how
Figure 1: Visualization of Owner Risk Exposure under Varying Guarantee Types
18
JANUARY•FEBRUARY2019 /// www.nacleanenergy.com
